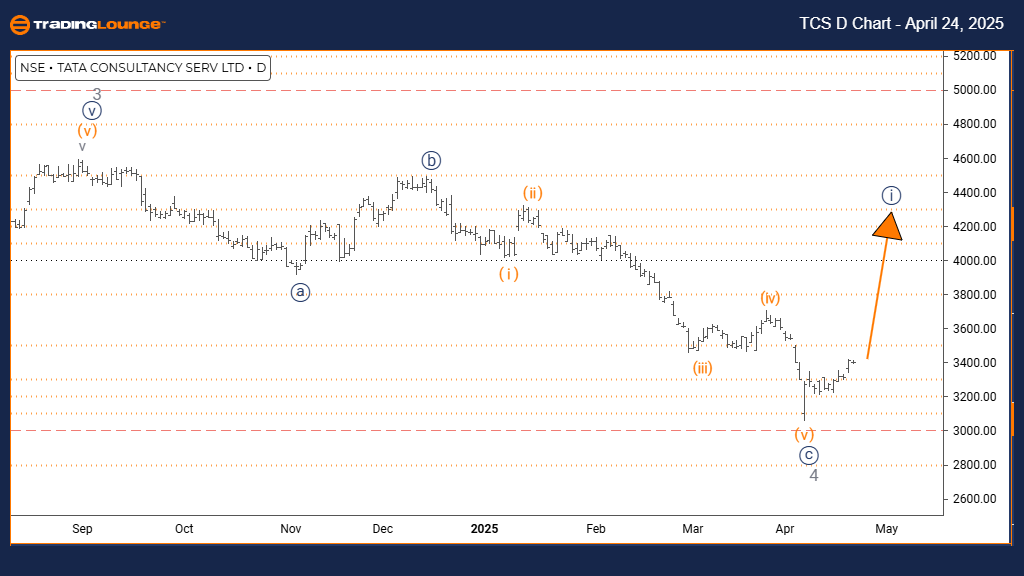
TATA Consultancy Services Corp Elliott Wave Analysis – TradingLounge Day Chart
TATA Consultancy Services Corp Day Chart Analysis
TATA Consultancy Services Corp. Elliott Wave Technical Analysis
FUNCTION: Bullish Trend
MODE: Impulsive
STRUCTURE: Navy blue wave 1
POSITION: Gray wave 5
DIRECTION NEXT LOWER DEGREES: Navy blue wave 2
DETAILS: Gray wave 4 appears complete. Navy blue wave 1 of 5 is currently unfolding.
TATA CONSULTANCY SERVICES CORP’s daily Elliott Wave chart reveals a strong bullish structure developing through an impulsive pattern. The recent completion of gray wave 4 signals a transition into navy blue wave 1, initiating the final phase of gray wave 5. This bullish breakout sets the stage for continued upward momentum before a deeper correction begins.
Navy blue wave 1 marks the start of the final impulsive wave in this bullish trend. This wave is typically marked by a steady price advance, growing volume, and increased market confidence. As gray wave 4's correction concludes, the emergence of navy blue wave 1 points toward renewed strength, potentially offering high-probability trade setups before navy blue wave 2 initiates a corrective pullback.
Once navy blue wave 1 completes, traders can anticipate navy blue wave 2—a temporary retracement providing a possible buy-the-dip scenario before prices resume upward in gray wave 5. The daily chart setup supports a bullish outlook, reinforcing the wave count and offering insight into the structure of the market’s next key movement.
Traders should look for classic wave 1 characteristics—gradual price gains, bullish momentum, and increasing participation. This phase not only offers long trade setups but also signals that the larger bullish cycle is nearing completion. As gray wave 5 progresses, remain vigilant for signs of trend exhaustion or divergence that often signal wave terminations within Elliott Wave theory.
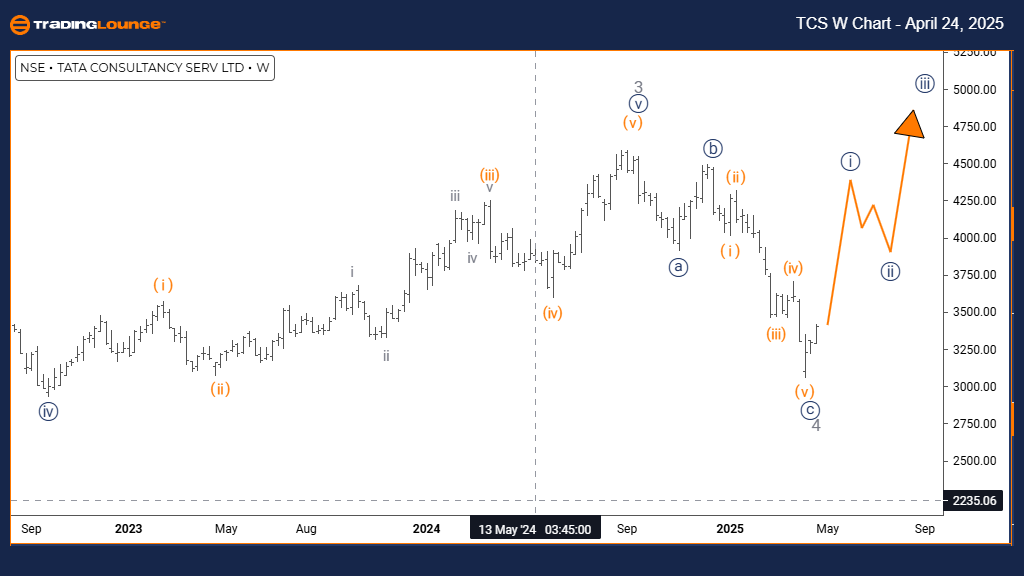
TATA Consultancy Services (TCS) Elliott Wave Analysis – TradingLounge Weekly Chart
TATA Consultancy Services Corp. Elliott Wave Technical Analysis
FUNCTION: Bullish Trend
MODE: Impulsive
STRUCTURE: Gray wave 5
POSITION: Orange wave 3
DIRECTION NEXT HIGHER DEGREES: Gray wave 5 (in progress)
DETAILS: Gray wave 4 appears complete. Gray wave 5 of 3 is currently unfolding.
On the weekly Elliott Wave chart, TATA CONSULTANCY SERVICES CORP maintains a bullish trajectory, advancing within an impulsive wave pattern. The successful completion of gray wave 4 correction has led to the development of gray wave 5, a component of the larger orange wave 3 structure—highlighting a strong upward continuation at this degree.
Gray wave 5 signals the terminal portion of the ongoing bullish sequence, often characterized by either a sharp rally or early signs of fatigue. With wave 4 behind, gray wave 5 aims to break above previous highs, potentially completing the impulsive structure at this wave degree. This stage is critical for identifying potential topping signals as momentum may begin to wane.
The weekly chart offers broader market perspective, indicating that TATA CONSULTANCY SERVICES CORP is likely in the later stages of its bullish cycle. While orange wave 3 can extend further, monitoring gray wave 5 for momentum divergence or topping formations is essential for anticipating a reversal or major correction.
This phase presents one of the last bullish trading opportunities before a trend shift. Traders should remain alert to Elliott Wave-ending signals—such as MACD divergence or wedge formations—that hint at cycle exhaustion. Even though wave 5 can extend unpredictably, proactive analysis is crucial.
Post wave 5 completion, a significant correction is probable. Combining Elliott Wave theory with momentum indicators and price action analysis can help traders confirm the transition from bullish impulse to corrective phase, offering guidance for medium-term trade setups and risk management strategies.
Technical Analyst: Malik Awais
Source: Visit Tradinglounge.com and learn from the Experts. Join TradingLounge Here
Previous: ITC INDIA Elliott Wave Technical Analysis
VALUE Offer - Buy 1 Month & Get 3 Months!Click here
Access 7 Analysts Over 200 Markets Covered. Chat Room With Support