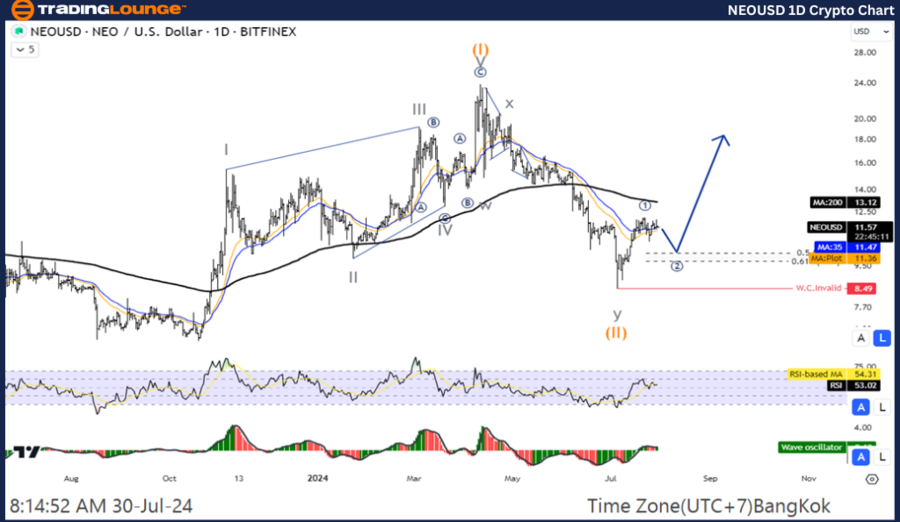
NEOUSD Elliott Wave Analysis - Daily Chart

NEO / U.S. Dollar (NEOUSD) Daily Chart Analysis

NEOUSD Elliott Wave Technical Analysis

Function: Counter Trend

Mode: Corrective

Structure: Double Corrective

Position: Wave Y

Next Higher Degrees Direction: Wave (II) of Impulse

Wave Cancel Invalid Level: 9.85

Details: The analysis indicates that Wave (II) has likely concluded, with prices starting an upward movement.

NEO / U.S. Dollar (NEOUSD) Trading Strategy:

The Wave (II) phase for NEOUSD appears to be ending around the 8.49 level, suggesting a potential resumption of the uptrend. Traders should consider entering the market during short-term pullbacks to align with the emerging uptrend.

NEO / U.S. Dollar (NEOUSD) Technical Indicators:

  • Trend Indicator: The price is positioned below the MA200, signalling a downtrend.

  • Momentum Indicator: The Wave Oscillator shows bullish momentum, suggesting a potential upward shift.

NEOUSD-1D-Crypto-Cha...


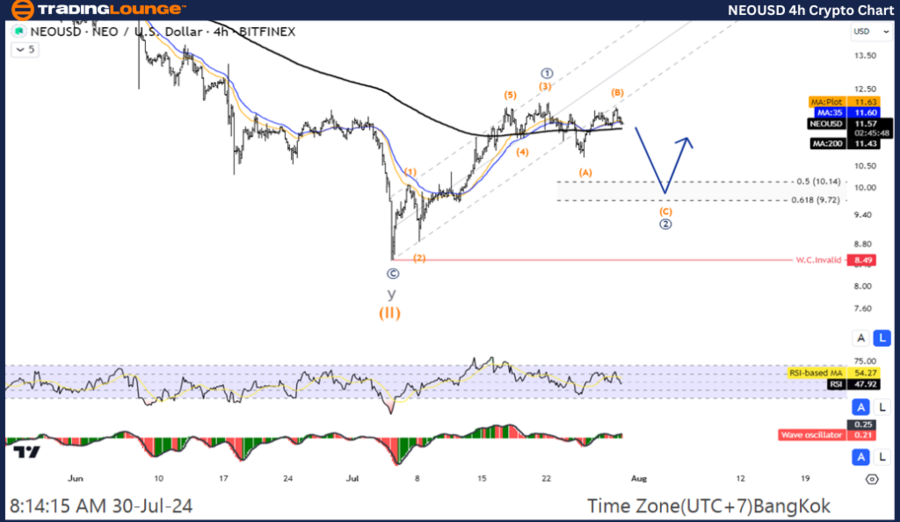
NEOUSD Elliott Wave Analysis - H4 Chart

NEO / U.S. Dollar (NEOUSD) 4-hour Chart Analysis

NEOUSD Technical Analysis

Function: Counter Trend

Mode: Corrective

Structure: Double Corrective

Position: Wave Y

Next Higher Degrees Direction: Wave (II) of Impulse

Wave Cancel Invalid Level: 9.85

Details: Similar to the daily chart, the 4-hour analysis suggests that Wave (II) has likely ended, and an uptrend may be resuming.

NEO / U.S. Dollar (NEOUSD) Trading Strategy:

For short-term traders, completing Wave (II) near the 8.49 level could provide a good opportunity to enter the market. The focus should be on capitalizing on short-term pullbacks to join the anticipated uptrend.

NEO / U.S. Dollar (NEOUSD) Technical Indicators

  • Trend Indicator: The current price remains below the MA200, indicating a prevailing downtrend.
  • Momentum Indicator: The Wave Oscillator reflects bullish momentum, which may support the expected upward movement.

Technical Analyst:  Kittiampon Somboonsod

Source: visit Tradinglounge.com and learn From the Experts Join TradingLounge Here 

See Previous: Bitcoin / U.S. Dollar (BTCUSD) Elliott Wave Technical Analysis

Special Trial Offer - 0.76 Cents a Day for 3 Months! Click here

Access 7 Analysts Over 170 Markets Covered. Chat Room With Support

NEOUSD-4hr-Crypto-Ch...

Related

Netflix Inc. (NFLX) Elliott Wave Technical Analysis: Netflix Stock Forecast, Wave 3 Progression, Wave 4 Pullback

Netflix Inc. (NFLX) Elliott Wave Technical Analysis: Netflix Stock Forecast, Wave 3 Progression, Wave 4 Pullback

NFLX Elliott Wave Analysis: We break down Netflix stock's technical structure using daily and on...

Read More >
Northern Star Resources NST Elliott Wave Technical Analysis to Help Guide Your Investment Decisions in the ASX Market

Northern Star Resources NST Elliott Wave Technical Analysis to Help Guide Your Investment Decisions in the ASX Market

Our detailed Elliott Wave analysis of Northern Star Resources (NST.ASX) highlights current market tr...

Read More >
USDJPY Elliott Wave Technical Analysis Shows U.S. Dollar/Japanese Yen Forex Currency Pair is Currently in a Downward Trend Phase

USDJPY Elliott Wave Technical Analysis Shows U.S. Dollar/Japanese Yen Forex Currency Pair is Currently in a Downward Trend Phase

The USDJPY currency pair is currently in a downward trend phase according to Elliott Wave analysis. ...

Read More >
U.S. Dollar / Japanese Yen (USDJPY) Elliott Wave Analysis: Daily and 4-Hour Chart Forecasts, Bullish Trends and Forex Trading

U.S. Dollar / Japanese Yen (USDJPY) Elliott Wave Analysis: Daily and 4-Hour Chart Forecasts, Bullish Trends and Forex Trading

USDJPY Elliott Wave analysis, covering both daily and 4-hour charts. Learn about the current bullish...

Read More >
FTSE 100 (UK) Elliott Wave Analysis: Bullish Trend, Wave Counts, Market Forecast, and Trading Strategies for Informed Decisions

FTSE 100 (UK) Elliott Wave Analysis: Bullish Trend, Wave Counts, Market Forecast, and Trading Strategies for Informed Decisions

Our FTSE 100 Elliott Wave analysis provides valuable insights into the market's bullish trend an...

Read More >
This article offers insights  into the Iron Ore Commodity Elliott Wave Technical Analysis Market's Future Movements

This article offers insights into the Iron Ore Commodity Elliott Wave Technical Analysis Market's Future Movements

This article provides a detailed Iron Ore Price Forecast using Elliott Wave Analysis. It covers curr...

Read More >

$1 for 2 Weeks

then $29 a month!

What a Special Offer!

Trade Recommendations

Unleash the power of deversified trading with our comprehensive portfolio, covering 250+ markets:

  • Stock Trades
  • Crypto Trades
  • Forex Trades
  • Commodity Trades
Elliott Wave Analysis

Gain a competitive edge with expert insights and AI-powered Elliott Wave charting into:

  • Global Indices
  • US Stocks & ASX Stocks
  • Forex & Crypto
  • Commodities
Top-Notch Trading Tools

Equip yourself with the tools of success:

  • Real-time Chat rooms
  • Elliott Wave Algorithm
  • Portfolio tools
  • TradingLevels
  • Screener
  • Trading Game
7 Elliott Wave Analysts

Stay ahead of the market with daily charts and insightful videos
Your secret to strategic trading!

JOIN HERE


Welcome to TradingLounge (ASIC A.R.No. 321187), specialists in trades, trading education and technical analysis, covering stocks, indices, commodities, forex and cryptocurrencies.

When you join TradingLounge you have access to everything we offer, including trade tools, educational content and a social platform to chat with like-minded investors.

Read more

@Copyright 2024 by tradinglounge.com

Contact Us

Australian no: 02 4787 6020

International no: +61 (2) 47876020

Pay with:

Find us on