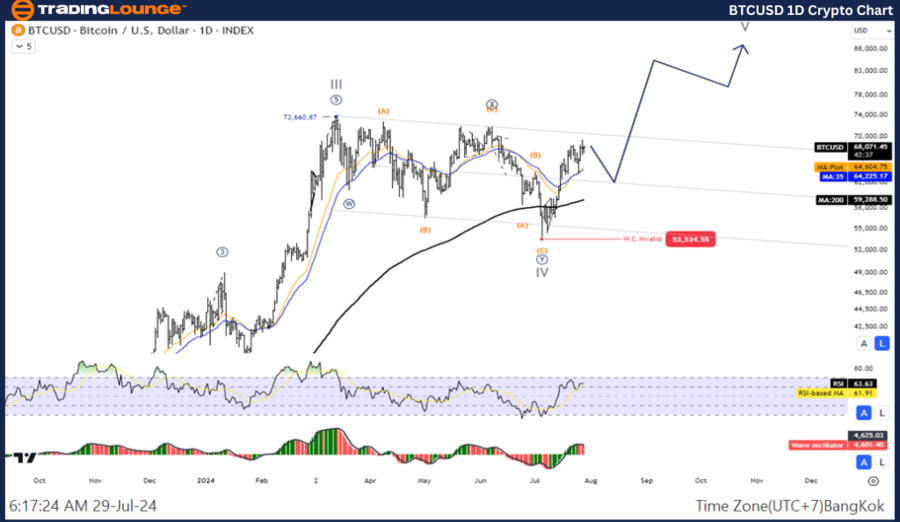
BTCUSD Elliott Wave Analysis - Daily Chart
Bitcoin / U.S. Dollar (BTCUSD) Daily Chart Analysis
BTCUSD Elliott Wave Technical Analysis
- Function: Follow Trend
- Mode: Motive
- Structure: Impulse
- Position: Wave (V)
- Next Higher Degree Direction: Wave ((I))
- Wave Cancel Invalid Level: N/A
- Details: The five-wave increase of Wave (V)
Bitcoin / U.S. Dollar (BTCUSD) Trading Strategy
The overall outlook for Bitcoin indicates that the correction phase concluded at the 53,534 level. Currently, the price is on an upward trajectory in Wave (V), potentially moving beyond 72,660. This presents a good opportunity to enter the uptrend.
Bitcoin / U.S. Dollar (BTCUSD) Technical Indicators
- The price is above the MA200, signifying an uptrend.
- The Wave Oscillator shows bullish momentum.

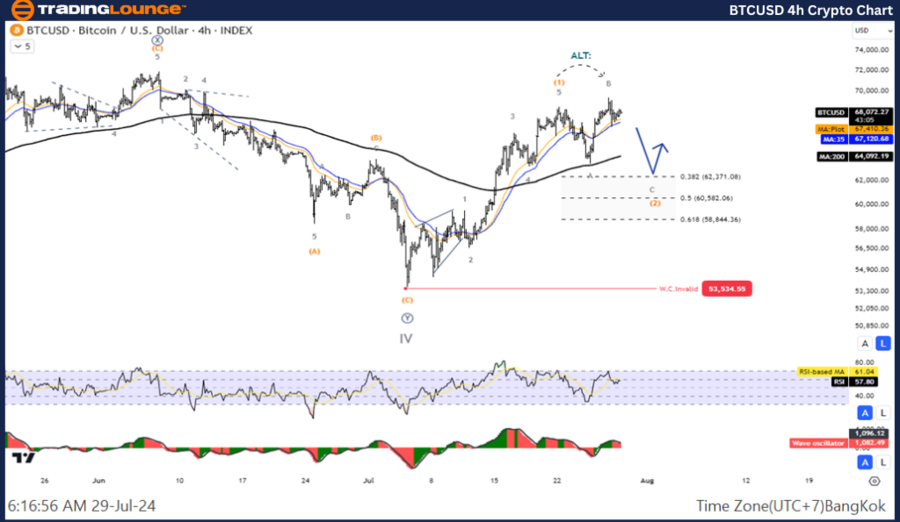
BTCUSD Elliott Wave Analysis - 4-Hour Chart
Bitcoin / U.S. Dollar (BTCUSD) 4-Hour Chart Analysis
BTCUSD Technical Analysis
- Function: Follow Trend
- Mode: Motive
- Structure: Impulse
- Position: Wave ((1))
- Next Higher Degree Direction: Wave (V)
- Wave Cancel Invalid Level: N/A
- Details: The five-wave increase of Wave ((1))
Bitcoin / U.S. Dollar (BTCUSD) Trading Strategy
Like the daily chart analysis, Bitcoin appears to have completed its correction phase at the 53,534 level, resuming an upward move in Wave (V) that could surpass the 72,660 mark. Traders should consider this as a potential entry point for the ongoing uptrend.
Bitcoin / U.S. Dollar (BTCUSD) Technical Indicators
- The price remains above the MA200, indicating a continued uptrend.
- The Wave Oscillator confirms bullish momentum.
Technical Analyst: Kittiampon Somboonsod
Source: visit Tradinglounge.com and learn From the Experts Join TradingLounge Here
See Previous: VeChain / U.S. Dollar (VETUSD) Elliott Wave Technical Analysis
Special Trial Offer - 0.76 Cents a Day for 3 Months! Click here
Access 7 Analysts Over 170 Markets Covered. Chat Room With Support
