Wheat Commodity Elliott Wave Technical Analysis

Wheat prices remain under strong bearish influence, with short- to medium-term projections aiming for the $500 support zone. Since March 2022, wheat futures have been trending lower, forming a prolonged downtrend. According to Elliott Wave wheat analysis, a corrective rebound could be on the horizon. However, before this potential recovery, prices may break through the $510 level and push lower toward $500 or beyond.

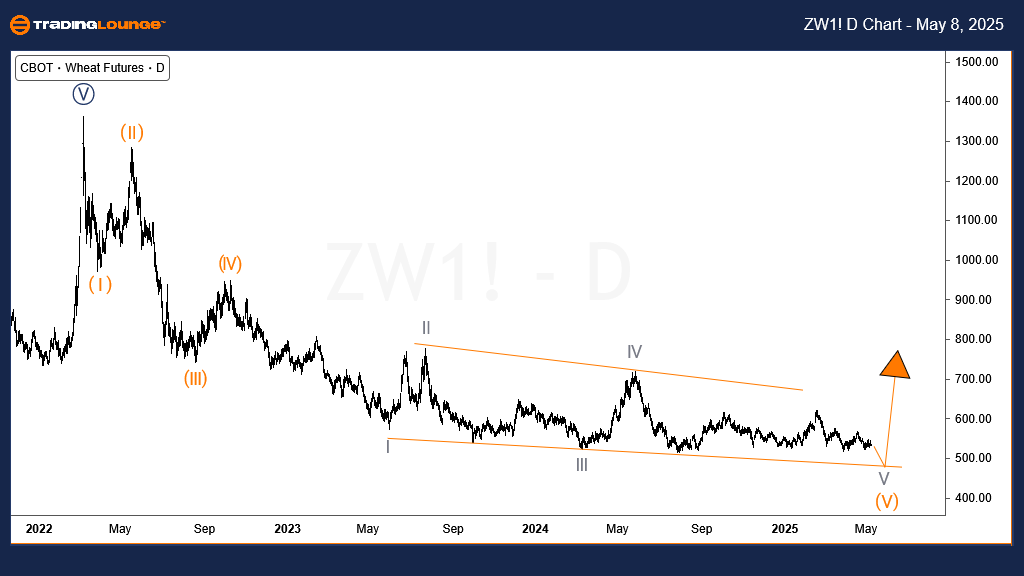
Wheat Elliott Wave Analysis – Daily Chart

The daily wheat chart highlights a nearing conclusion to the bearish trend that began in March 2022. This decline has unfolded through a classic 5-wave impulse structure. The current movement, identified as wave (V), appears to be shaping an ending diagonal—typically a signal that sellers may begin to lose strength. Presently, wheat price action is within wave V of (V), possibly marking the last leg of the downtrend. Inside wave V, sub-waves ((A)) and ((B)) have completed, while wave ((C)) is actively forming, likely approaching its mid-phase. This setup strengthens the case for a possible short-term reversal in the wheat price forecast.

Wheat-Commodity-day-...


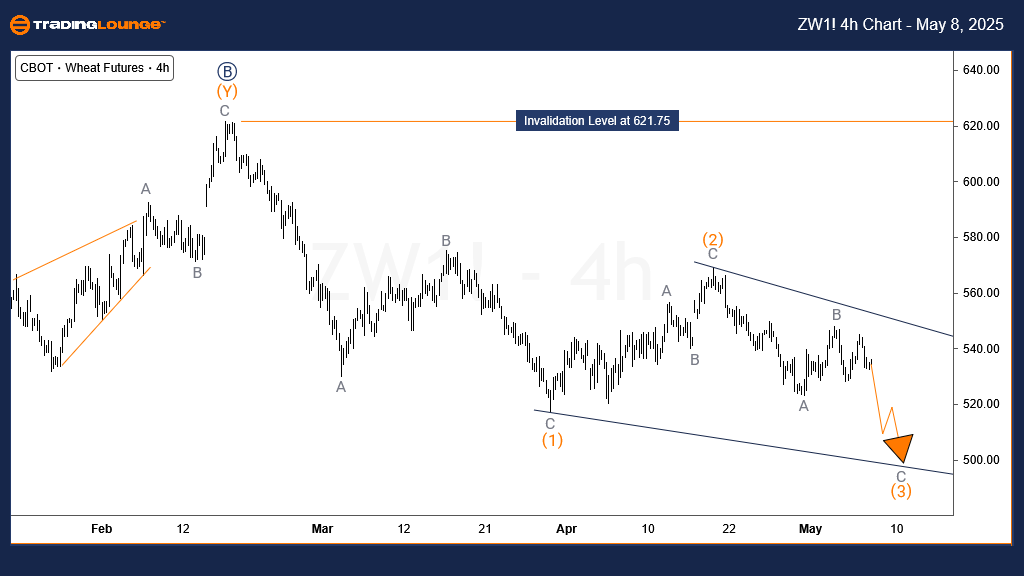
Wheat Elliott Wave Analysis – H4 Chart

On the 4-hour timeframe, wheat technical analysis shows wave ((C)) of V may be constructing an ending diagonal, completing a broader 5-3-5 zigzag corrective structure since the May 2024 swing high. Confirmation of this diagonal in wave ((C)) is key for determining short-term trend direction. Should wave (3) of ((C)) finalize its move lower, prices could soon test the $500 level. While short-term traders may continue to find selling opportunities during intraday bounces, long-term traders should be cautious. A shift from the prolonged bearish trend could develop if this diagonal structure completes, hinting at an upcoming reversal in the wheat trading signals.

Technical Analyst: Sanmi Adeagbo

Source: Visit Tradinglounge.com and learn from the Experts. Join TradingLounge Here 

See Previous: Cocoa Elliott Wave Technical Analysis

VALUE Offer - Buy 1 Month & Get 3 Months!Click here

Access 7 Analysts Over 200 Markets Covered. Chat Room With Support

Wheat-Commodity-4h-c...

Related

QUALCOMM (QCOM) Technical Analysis Reveals Bullish Elliott Wave Setup with Price Prediction and Trend Forecast on Charts

QUALCOMM (QCOM) Technical Analysis Reveals Bullish Elliott Wave Setup with Price Prediction and Trend Forecast on Charts

This technical analysis of QUALCOMM (QCOM) uses Elliott Wave Theory to forecast bullish trends and p...

Read More >
NZDUSD Elliott Wave Analysis Reveals Bullish Impulse Trend Forming with Wave 1 Setup on Daily and 4-Hour Charts

NZDUSD Elliott Wave Analysis Reveals Bullish Impulse Trend Forming with Wave 1 Setup on Daily and 4-Hour Charts

NZDUSD is forming wave 1 of a new bullish trend. Daily and 4-hour Elliott Wave charts suggest early ...

Read More >
WTI Crude Oil Commodity Elliott wave Technical analysis: Current Trends and Future Expectations

WTI Crude Oil Commodity Elliott wave Technical analysis: Current Trends and Future Expectations

This article provides an in-depth analysis of WTI using Elliott Wave Theory, focusing on the current...

Read More >
Elliott WaveTechnical Analysis of Iron Ore Market: SGX TSI Index Insights, Price Trends, Technical Forecasts, and Key Market Dynamics

Elliott WaveTechnical Analysis of Iron Ore Market: SGX TSI Index Insights, Price Trends, Technical Forecasts, and Key Market Dynamics

This article offers a comprehensive Elliott Wave analysis of the iron ore market, focusing on price ...

Read More >
Cocoa Elliott Wave Analysis: Price Forecast, Fibonacci Support, and Bullish Wave 3 Setup for 2024 Trading Strategy

Cocoa Elliott Wave Analysis: Price Forecast, Fibonacci Support, and Bullish Wave 3 Setup for 2024 Trading Strategy

Cocoa is currently pulling back from its all-time high, but the bullish Elliott Wave structure remai...

Read More >
Day and 4-hour Chart for British Pound/U.S.Dollar (GBPUSD) Elliott Wave Technical Analysis

Day and 4-hour Chart for British Pound/U.S.Dollar (GBPUSD) Elliott Wave Technical Analysis

Our GBP/USD Elliott Wave Analysis for the 4-hour chart on 13 March 24 suggests an ongoing impulsive ...

Read More >

$1 for 2 Weeks

then $29 a month!

What a Special Offer!

Trade Recommendations

Unleash the power of deversified trading with our comprehensive portfolio, covering 250+ markets:

  • Stock Trades
  • Crypto Trades
  • Forex Trades
  • Commodity Trades
Elliott Wave Analysis

Gain a competitive edge with expert insights and AI-powered Elliott Wave charting into:

  • Global Indices
  • US Stocks & ASX Stocks
  • Forex & Crypto
  • Commodities
Top-Notch Trading Tools

Equip yourself with the tools of success:

  • Real-time Chat rooms
  • Elliott Wave Algorithm
  • Portfolio tools
  • TradingLevels
  • Screener
  • Trading Game
7 Elliott Wave Analysts

Stay ahead of the market with daily charts and insightful videos
Your secret to strategic trading!

JOIN HERE


Welcome to TradingLounge (ASIC A.R.No. 321187), specialists in trades, trading education and technical analysis, covering stocks, indices, commodities, forex and cryptocurrencies.

When you join TradingLounge you have access to everything we offer, including trade tools, educational content and a social platform to chat with like-minded investors.

Read more

@Copyright 2024 by tradinglounge.com

Contact Us

Australian no: 02 4787 6020

International no: +61 (2) 47876020

Pay with:

Find us on