Cocoa Commodity Elliott Wave Technical Analysis
Cocoa continues to correct within its broader bullish trend, focusing on the strong upward cycle that began in September 2022. While the overall Cocoa price trend is expected to stay bullish in the long term, the corrective pullback that started in December 2024 seems to be ongoing and not yet complete.
Cocoa Long-Term View (Weekly Chart)
The Cocoa market’s supercycle bullish move started back in April 2017, clearly visible on the weekly chart. Waves (I) and (II) finished by April 2018 and October 2018, respectively. Afterward, the market experienced a choppy phase, developing waves I and II of (III), and later, waves ((1)) and ((2)) of III, spanning October 2018 to September 2022. A major breakout emerged in late 2022, driving Cocoa prices past 11,000 and finalizing wave ((3)) of III. Cocoa prices peaked in December 2024, triggering the current pullback for wave IV. According to the H4 chart analysis, wave IV still looks incomplete.

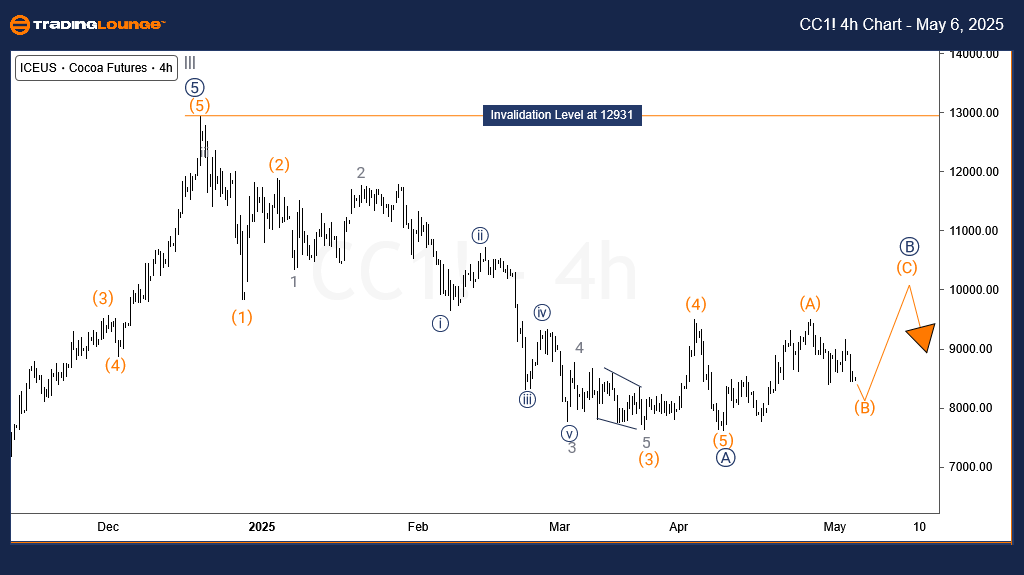
Cocoa H4 Chart Analysis
On the H4 timeframe, Cocoa prices formed wave ((A)) of IV through an impulsive decline. A corrective bounce is developing as wave ((B)), and it appears wave ((B)) may extend one more leg higher to complete wave (C) of ((B)), as long as the 12931 record high remains unbroken. Thus, in the near term, the Cocoa market outlook favors a downward move. Nonetheless, the broader Cocoa Elliott Wave forecast stays bullish, with expectations for a strong rise in wave V of (III).
Technical Analyst: Sanmi Adeagbo
Source: Visit Tradinglounge.com and learn from the Experts Join TradingLounge Here
See Previous: Natural Gas Elliott Wave Technical Analysis
VALUE Offer - Buy 1 Month & Get 3 Months!Click here
Access 7 Analysts Over 200 Markets Covered. Chat Room With Support