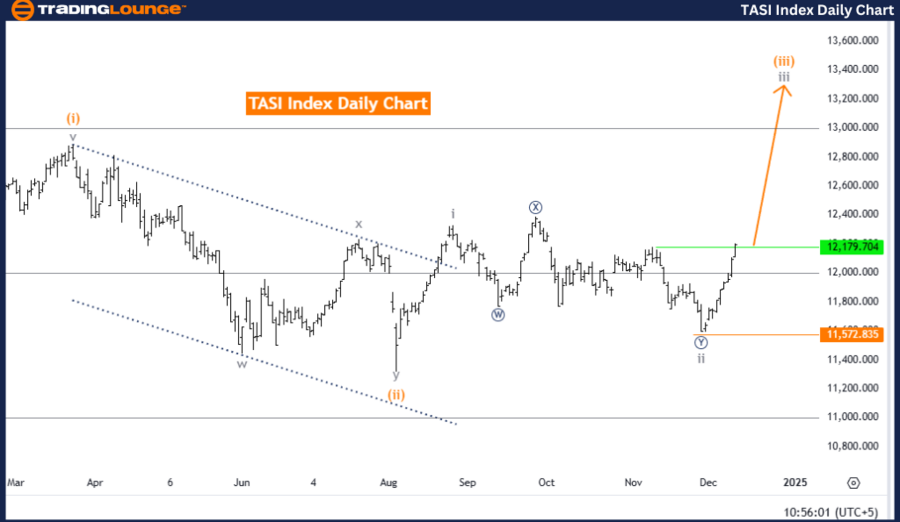
TASI Index Elliott Wave Analysis - Trading Lounge Day Chart
TASI Index Elliott Wave Technical Analysis
Function: Bullish Trend
Mode: Impulsive
Structure: Gray Wave 3
Position: Orange Wave 3
Direction (Next Higher Degrees): Gray Wave 3 (initiated)
Details: Gray Wave 2 appears complete, and Gray Wave 3 is currently progressing.
Wave Invalid Level: 11,572.835
The daily chart analysis for the TASI Index reflects a bullish trend based on Elliott Wave principles. The structure is identified as Gray Wave 3 in an impulsive mode, with Orange Wave 3 actively advancing. This suggests continued upward momentum aligning with the overall bullish sentiment.
Key Insights
- Gray Wave 2 Completion: The analysis highlights the completion of Gray Wave 2, marking the start of Gray Wave 3's progression.
- Momentum Driven by Impulsive Waves: As per Elliott Wave Theory, impulsive waves signify strong directional trends. The ongoing development of Gray Wave 3 indicates sustained bullish momentum with potential for further market gains.
- Invalidation Level at 11,572.835: If prices fall below this level, the current wave structure will be invalidated, necessitating a reevaluation of the bullish scenario.
This detailed analysis underlines the strong bullish trend in the TASI Index. Transitioning from Gray Wave 2 to the active progression of Gray Wave 3 showcases robust upward momentum. Investors and traders can utilize these insights to anticipate further market growth and refine their trading strategies.
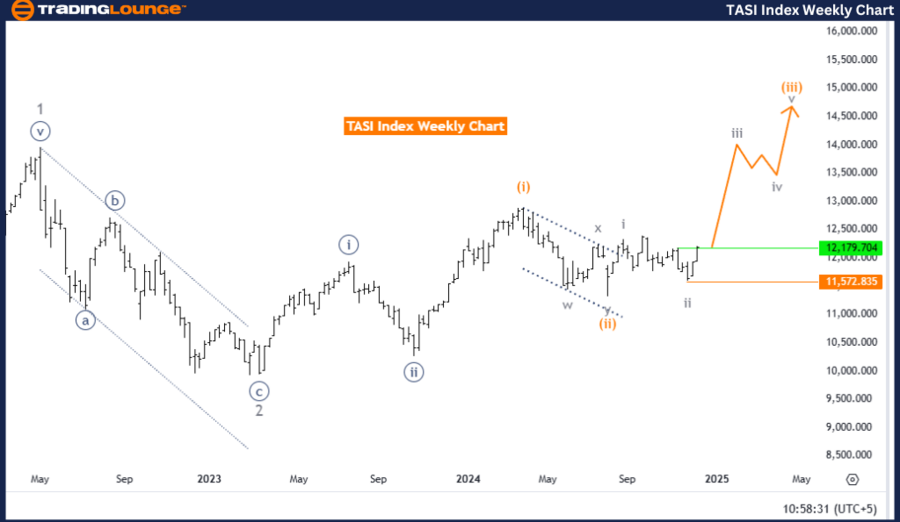
TASI Index Elliott Wave Analysis - Trading Lounge Weekly Chart
TASI Index Elliott Wave Technical Analysis
Function: Bullish Trend
Mode: Impulsive
Structure: Gray Wave 3
Position: Orange Wave 3
Direction (Next Higher Degrees): Gray Wave 3 (initiated)
Details: Gray Wave 2 has been completed, and Gray Wave 3 is actively progressing.
Wave Invalid Level: 11,572.835
The weekly chart analysis of the TASI Index confirms a bullish trend based on Elliott Wave Theory. The structure is defined as Gray Wave 3 within an impulsive mode, and Orange Wave 3 is unfolding, reinforcing strong upward momentum in line with broader market trends.
Key Insights
- Gray Wave 2 Completion: Completion of Gray Wave 2 paves the way for the active progression of Gray Wave 3.
- Strength in Impulsive Waves: Impulsive waves indicate dominant market trends in Elliott Wave Theory. The development of Gray Wave 3 highlights sustained growth potential with opportunities for additional market gains.
- Invalidation Level at 11,572.835: A drop below this level would invalidate the current wave structure, prompting a reassessment of the bullish perspective.
This analysis reinforces the upward trajectory of the TASI Index. The transition from the corrective phase of Gray Wave 2 to the impulsive phase of Gray Wave 3 indicates strong bullish momentum. Traders and investors can rely on this structured evaluation to anticipate continued growth and align their strategies with prevailing market dynamics.
Technical Analyst: Malik Awais
Source: visit Tradinglounge.com and learn From the Experts Join TradingLounge Here
Previous: NASDAQ Index Elliott Wave Technical Analysis
VALUE Offer - Buy 1 Month & Get 3 Months!Click here
Access 7 Analysts Over 200 Markets Covered. Chat Room With Support