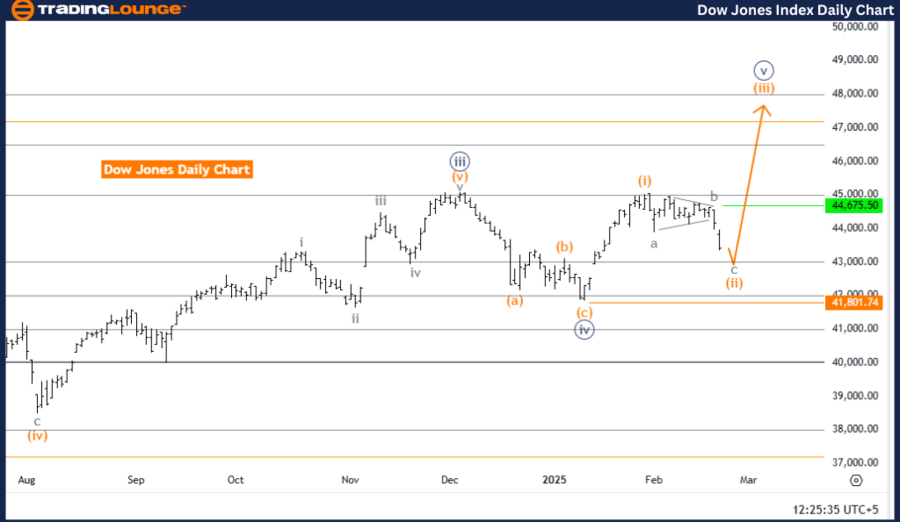
DOW JONES (DJI) Elliott Wave Analysis – Trading Lounge Day Chart
DOW JONES (DJI) Day Chart Analysis
DOW JONES (DJI) Elliott Wave Technical Analysis
Function: Counter Trend
Mode: Corrective
Structure: Orange Wave 2
Position: Navy Blue Wave 5
Next Higher Degree Direction: Orange Wave 3
Wave Cancellation Invalid Level: 41801.74
DOW JONES (DJI) Index Analysis Details
The DOW JONES Industrial Average (DJI) Elliott Wave Analysis on the daily chart indicates a counter-trend corrective phase, suggesting that the market is undergoing a retracement before the next impulsive move.
The current wave structure positions the market in Orange Wave 2, part of a broader corrective sequence within Navy Blue Wave 5. This implies that the market is in a temporary pullback before resuming the larger trend. The next anticipated movement is Orange Wave 3, which is expected to drive the market higher upon completing the ongoing correction.
The completion of Orange Wave 1 has set the stage for Orange Wave 2, which is likely to exhibit typical corrective characteristics, such as sideways consolidation or downward price movements. Traders should prepare for possible fluctuations before the onset of Orange Wave 3, which is projected to align with the dominant trend.
A critical price level to monitor is 41801.74—the Wave Cancellation Invalid Level. If the market price surpasses this threshold, the current wave count will be invalidated, requiring a reassessment of the Elliott Wave structure. This level serves as a significant resistance point, and a break above it may signal a shift in the market outlook.
Summary
- DOW JONES (DJI) remains in a corrective phase within the Elliott Wave framework, with Orange Wave 2 unfolding after Orange Wave 1’s completion.
- This correction is part of Navy Blue Wave 5, and the next anticipated wave is Orange Wave 3, expected to drive the market higher.
- Key Level to Watch: 41801.74 – If the price exceeds this level, the current wave count will become invalid.
- Understanding Elliott Wave structures helps traders anticipate market movements and align their trading strategies accordingly.
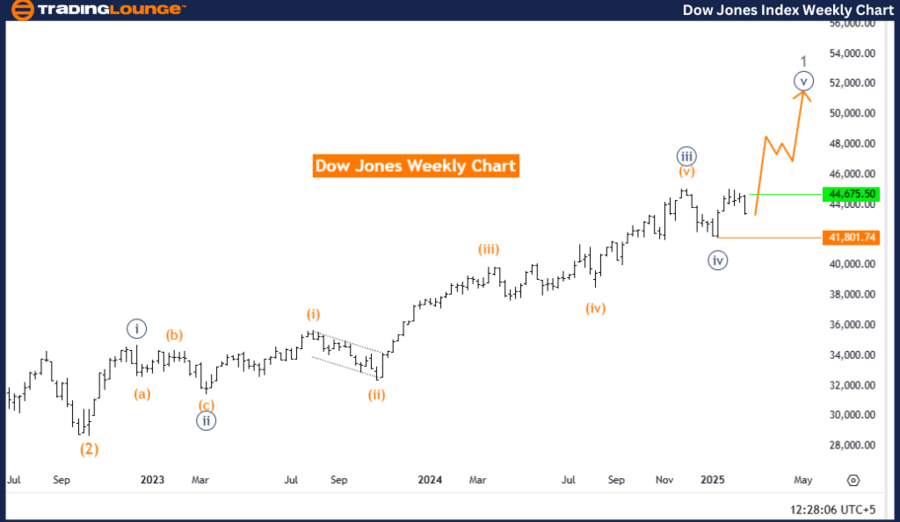
DOW JONES (DJI) Elliott Wave Analysis – Trading Lounge Weekly Chart
DOW JONES (DJI) Elliott Wave Technical Analysis
- Function: Bullish Trend
- Mode: Impulsive
- Structure: Navy Blue Wave 5
- Position: Gray Wave 1
- Next Lower Degree Direction: Gray Wave 2
- Wave Cancellation Invalid Level: 41801.74
DOW JONES Index Analysis Details
The DOW JONES Industrial Average (DJI) Elliott Wave Analysis on the weekly chart signals a bullish trend, with the market progressing within an impulsive wave sequence.
The structure highlights Navy Blue Wave 5, forming part of a larger upward movement inside Gray Wave 1. This setup reflects a strong bullish momentum, characteristic of impulsive wave structures. The next expected movement is Gray Wave 2, which may introduce a temporary corrective phase after Navy Blue Wave 5 is complete.
With Navy Blue Wave 4 already concluded, the market has now entered Navy Blue Wave 5, which is anticipated to demonstrate strong upward momentum. Traders should monitor this wave closely, as its completion may mark the beginning of Gray Wave 2, a correction that could trigger short-term pullbacks or market consolidation before the uptrend resumes.
A crucial price level to track is 41801.74, the Wave Cancellation Invalid Level. A drop below this threshold would invalidate the current wave count, necessitating a fresh analysis of the wave structure. This level functions as a major support zone, and a breakdown below it might indicate a shift in trend dynamics.
Summary
- DOW JONES (DJI) remains in a strong bullish phase, with Navy Blue Wave 5 currently unfolding after Navy Blue Wave 4’s completion.
- The next expected movement is Gray Wave 2, which could introduce a short-term corrective pullback before the bullish trend continues.
- Key Level to Watch: 41801.74 – If the price falls below this level, the existing Elliott Wave count becomes invalid.
- Elliott Wave analysis is crucial for forecasting market trends, helping traders make informed decisions and optimize their trading strategies.
Technical Analyst: Malik Awais
Source: visit Tradinglounge.com and learn From the Experts Join TradingLounge Here
Previous: S&P/TSX 60 Elliott Wave Technical Analysis
VALUE Offer - Buy 1 Month & Get 3 Months!Click here
Access 7 Analysts Over 200 Markets Covered. Chat Room With Support