21Feb

S&P/TSX 60 Elliott Wave Technical Analysis: Market Trends, Corrective Wave Structure, Stock Forecast, Trading Strategy

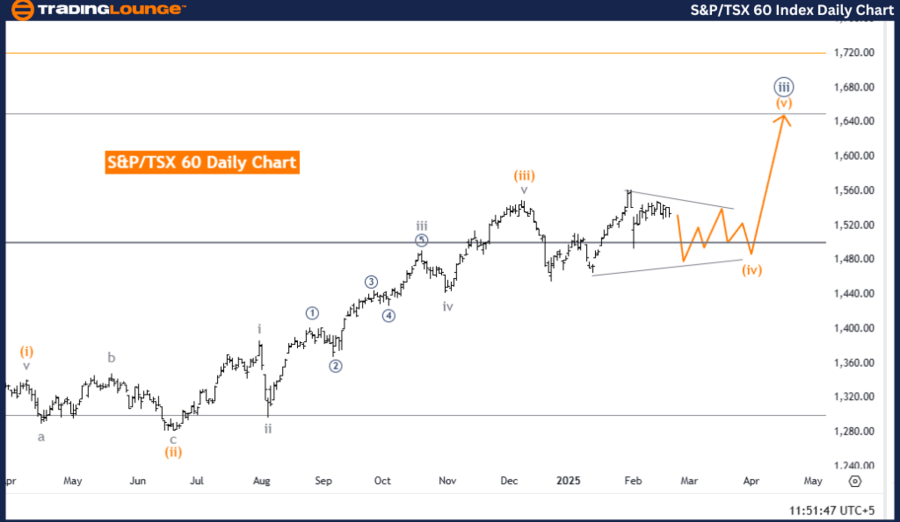
S&P/TSX 60 Elliott Wave Analysis – Trading Lounge Day Chart

S&P/TSX 60 Elliott Wave Technical Analysis

Function: Counter Trend

Mode: Corrective

Structure: Orange Wave 4

Position: Navy Blue Wave 3

Direction Next Higher Degree: Orange Wave 5

Analysis Details

The S&P/TSX 60 daily chart is currently exhibiting a counter-trend correction, aligning with a corrective wave structure as part of Elliott Wave Theory. The market is navigating Orange Wave 4, indicating a temporary retracement within the overarching bullish trend.

Previously, Orange Wave 3 reached completion, marking a shift into the corrective phase of Orange Wave 4. This correction is an expected pause before the potential resumption of the broader uptrend.

Currently, the market sits within Navy Blue Wave 3, representing an intermediate correction inside the larger structure. The anticipated next major movement is Orange Wave 5, expected to commence post the resolution of Orange Wave 4.

Summary

The S&P/TSX 60 daily analysis confirms that the index is in a corrective phase within an ongoing larger uptrend. Orange Wave 4 is actively forming following the completion of Orange Wave 3, hinting at a temporary pullback before a potential rally into Orange Wave 5.

The market remains in a counter-trend state, and further developments are necessary to validate the next directional movement.

SP-TSX60-index-daily...


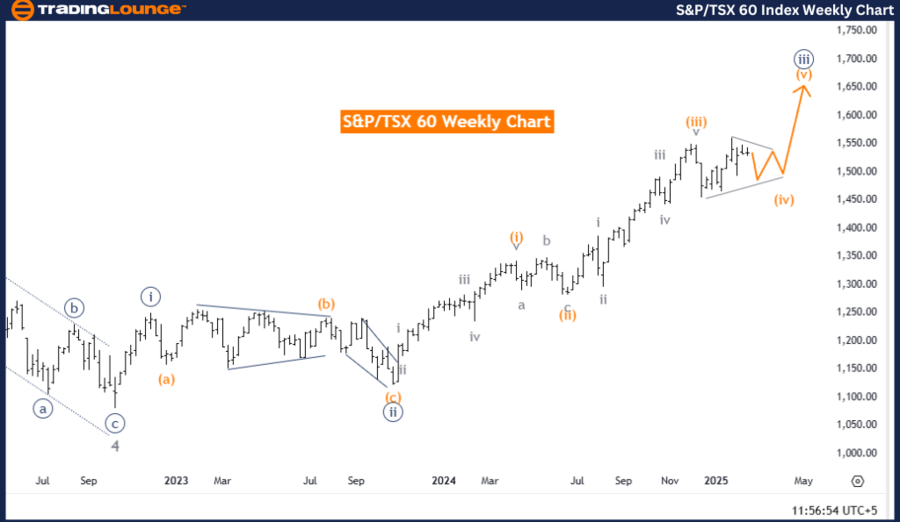
S&P/TSX 60 Elliott Wave Analysis – Trading Lounge Weekly Chart

S&P/TSX 60 Elliott Wave Technical Analysis

Function: Counter Trend

Mode: Corrective

Structure: Orange Wave 4

Position: Navy Blue Wave 3

Direction Next Higher Degree: Orange Wave 5

Analysis Details

The S&P/TSX 60 weekly chart aligns with Elliott Wave Theory, showcasing a corrective counter-trend movement within the broader market cycle. The market is currently navigating Orange Wave 4, signaling a retracement phase before the expected continuation of the uptrend.

With Orange Wave 3 appearing complete, the market has entered Orange Wave 4, a necessary corrective phase before potentially progressing into Orange Wave 5. This correction suggests short-term consolidation before a probable bullish breakout.

Positioned within Navy Blue Wave 3, the market is experiencing an intermediate correction inside a broader bullish structure. The next higher-degree move remains Orange Wave 5, anticipated upon completion of Orange Wave 4.

Summary

The S&P/TSX 60 weekly chart analysis confirms an ongoing corrective wave structure within a larger bullish trend. The unfolding Orange Wave 4 represents a temporary pullback, likely preceding an eventual continuation into Orange Wave 5.

While the market stays in a counter-trend formation, further confirmations are needed to determine the next major directional move.

Technical Analyst: Malik Awais

Source: visit Tradinglounge.com and learn From the Experts Join TradingLounge Here 

Previous: CAC 40 (France) Elliott Wave Technical Analysis

VALUE Offer - Buy 1 Month & Get 3 Months!Click here

Access 7 Analysts Over 200 Markets Covered. Chat Room With Support

SP-TSX60-index-weekl...

Related

Polkadot/U.S. dollar(DOTUSD) Elliott Wave Technical Analysis 19 October 23

Polkadot/U.S. dollar(DOTUSD) Elliott Wave Technical Analysis 19 October 23

DOTUSD Elliott Wave Analysis TradingLounge Daily and 4-hour Chart for 19 October 23.

Read More >
Offering Insights into Binance Crypto Price News Today Binance / U.S. Dollar (BNBUSD) Elliott Wave Technical Analysis

Offering Insights into Binance Crypto Price News Today Binance / U.S. Dollar (BNBUSD) Elliott Wave Technical Analysis

This article provides a detailed BNBUSD Elliott Wave analysis, offering insights into Binance Coin&#...

Read More >
UNI Price Prediction and Elliott Wave Chart Analysis Reveal Bullish Wave 3 Forming After Zigzag Correction at Key Support

UNI Price Prediction and Elliott Wave Chart Analysis Reveal Bullish Wave 3 Forming After Zigzag Correction at Key Support

UNI/USD shows bullish strength after ending a Zigzag correction. A clear impulse Wave 3 is forming—...

Read More >
AMCOR PLC – AMC Elliott Wave Forecast Reveals Bullish Wave 3 Setup with Price Targets, Stock Analysis, and Trading Strategy

AMCOR PLC – AMC Elliott Wave Forecast Reveals Bullish Wave 3 Setup with Price Targets, Stock Analysis, and Trading Strategy

AMCOR PLC (ASX: AMC) uses Elliott Wave Theory to forecast a potential bullish trend. With Wave (2) c...

Read More >
XRP Crypto Price News Today Elliott Wave Technical Analysis: Predicting Price Movements and Strategies

XRP Crypto Price News Today Elliott Wave Technical Analysis: Predicting Price Movements and Strategies

Gain insights into XRP/USD with our Elliott Wave analysis. Learn about XRP price predictions, tradin...

Read More >

Buy 1 Month

Get 3 Months!

Special Offer:

Trade Recommendations

Unleash the power of deversified trading with our comprehensive portfolio, covering:

  • Stock Trades
  • Crypto Trades
  • Forex Trades
  • Commodity Trades
Elliott Wave Analysis

Gain a competive edge with expert insights in to:

  • Global Indices
  • US Stocks & ASX Stocks
  • Forex & Crypto
  • Commodities
Top-Notch Trading Tools

Equip yourself with the tools of success:

  • Social Chat
  • Elliott Wave Algorithm
  • Screener
  • TradingLevels
  • Trading Game
7 Elliott Wave Analysts

Stay ahead of the market with daily charts and insightful videos
-Your secret to strategic trading!

JOIN HERE


Welcome to TradingLounge (ASIC A.R.No. 321187), specialists in trades, trading education and technical analysis, covering stocks, indices, commodities, forex and cryptocurrencies.

When you join TradingLounge you have access to everything we offer, including trade tools, educational content and a social platform to chat with like-minded investors.

Read more

@Copyright 2024 by tradinglounge.com

Contact Us

Australian no: 02 4787 6020

International no: +61 (2) 47876020

Pay with:

Find us on