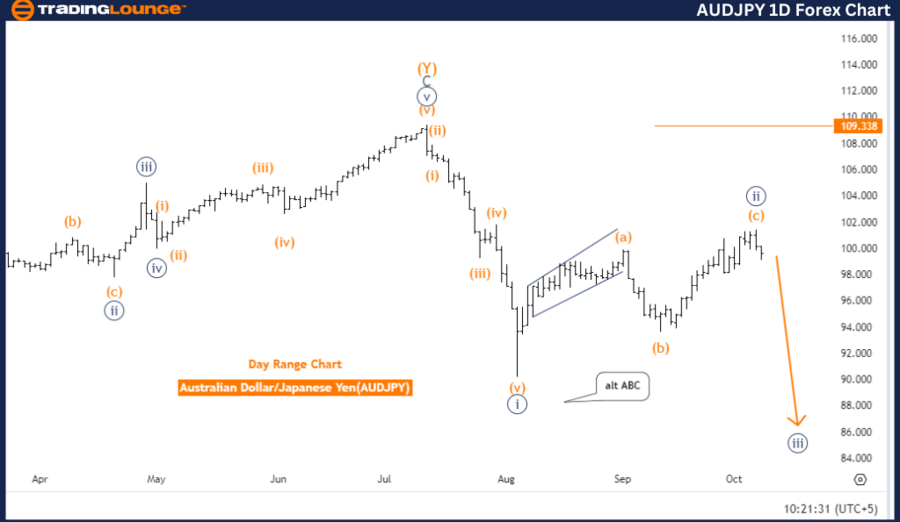
Australian Dollar/Japanese Yen Currency Pair - TradingLounge 1D Chart
Australian Dollar / Japanese Yen (AUDJPY) Day Chart
AUDJPY Elliott Wave Technical Analysis
Trend: Bearish
Mode: Impulsive
Structure: Navy blue wave 3
Next Lower Degree Wave: Navy blue wave 3 (ongoing)
The AUDJPY Elliott Wave Analysis on the daily chart underscores a bearish trend in an impulsive mode, indicating strong downward momentum. The current structure being monitored is navy blue wave 3, a critical phase within this larger bearish trend.
Wave 2 Completion and Wave 3 Progress
The completion of navy blue wave 2 signals the end of the previous corrective phase, setting the stage for the continuation of the bearish trend with navy blue wave 3 now in progress. This wave is expected to push the market lower, reinforcing the downward trajectory.
The market remains firmly within navy blue wave 3, suggesting sustained downward pressure in the near term. This wave is an integral part of the larger bearish structure, projecting additional price declines.
Invalidation Level: 109.338
The invalidation level for this wave structure is set at 109.338. A break above this level would invalidate the current wave count, indicating a need to reassess the bearish outlook. Traders should monitor this level closely as it serves as a key reference for confirming the current wave pattern.
Summary
The daily AUDJPY chart reflects a robust bearish trend, with navy blue wave 3 actively unfolding. After the completion of navy blue wave 2, the market has entered a new impulsive phase, and further price declines are expected unless the price breaks the 109.338 invalidation level. The analysis indicates continued bearish pressure in the near term.
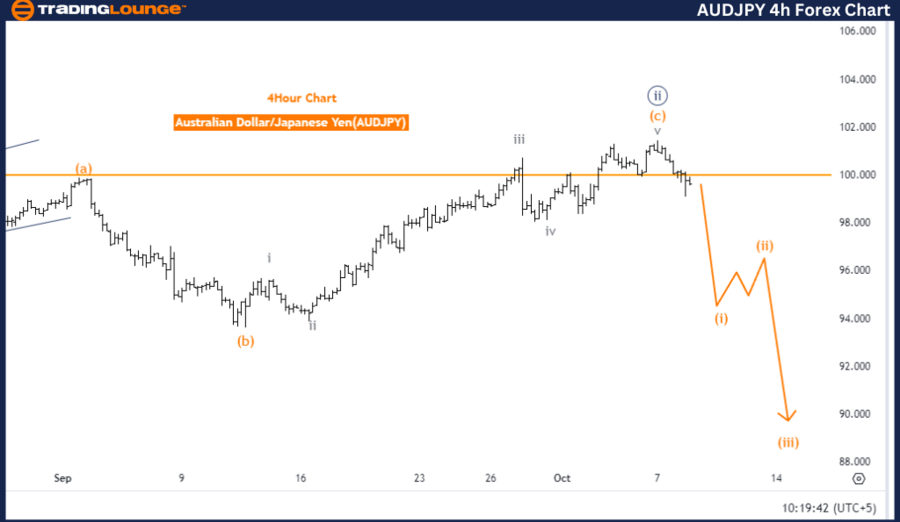
Australian Dollar/Japanese Yen Forex Pair - TradingLounge 4h Chart
Australian Dollar / Japanese Yen (AUDJPY) 4-Hour Chart
AUDJPY Elliott Wave Technical Analysis
Trend: Bullish
Mode: Impulsive
Structure: Orange wave 1
Position: Navy blue wave 3
Next Higher Degree Wave: Orange wave 2 (pending)
On the AUDJPY 4-hour chart, the Elliott Wave Analysis reveals a bullish trend in impulsive mode, highlighting a strong upward move. The primary structure is orange wave 1, part of a larger trend, with the current price action situated within navy blue wave 3—a crucial phase in the ongoing bullish movement.
Wave 2 Completion and Wave 1 Progress
With navy blue wave 2 now complete, the market is experiencing a renewed upward thrust as orange wave 1 of navy blue wave 3 takes shape, driving the price higher in the ongoing impulsive wave.
Next Phase: Orange Wave 2
Once orange wave 1 concludes, the next phase will involve orange wave 2, likely introducing a short-term correction before the bullish trend resumes. The immediate focus remains on orange wave 1, signaling continued bullish action in the short term.
Invalidation Level: 109.338
The invalidation level for this bullish structure is 109.338. A drop below this threshold would invalidate the current wave count, necessitating a reevaluation of the analysis. This level is key for validating the ongoing bullish wave structure.
Summary
The 4-hour AUDJPY chart indicates a strong bullish trend, with orange wave 1 of navy blue wave 3 currently active following the completion of navy blue wave 2. The market is expected to continue upward unless the price drops below the 109.338 invalidation level, which would require a reassessment of the wave count.
Technical Analyst: Malik Awais
Source: visit Tradinglounge.com and learn From the Experts Join TradingLounge Here
Previous: Australian Dollar/U.S. Dollar (AUDUSD) Elliott Wave Technical Analysis
VALUE Offer - Buy 1 Month & Get 3 Months!Click here
Access 7 Analysts Over 200 Markets Covered. Chat Room With Support