09May

Polkadot Forecast and DOTUSD Elliott Wave Analysis, Confirming Bullish Breakout and Trend Continuation from Fibonacci Zone

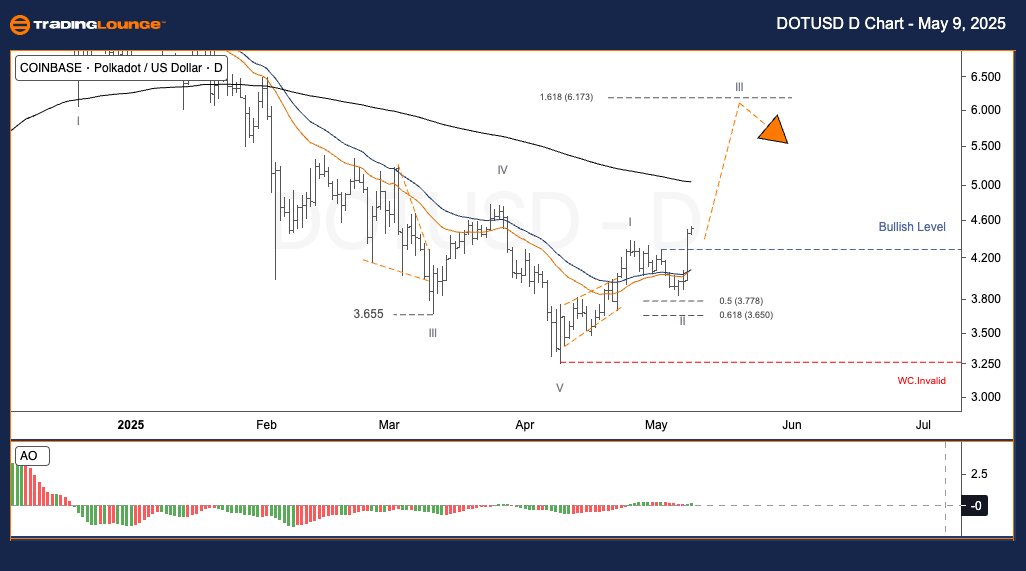
DOTUSD Elliott Wave Analysis – TradingLounge Daily Chart

Polkadot/U.S. Dollar (DOTUSD) Daily Chart Analysis

DOTUSD Elliott Wave Technical Analysis

Function: Trend Continuation

Mode: Motive

Structure: Impulse

Current Wave Position: Wave 3

Next Higher Degree Direction: Uptrend

Wave Cancel Invalid Level: Below Support Zone

DOTUSD Trading Strategy – Daily Chart

Polkadot (DOT) shows a bullish momentum, signaling the start of wave III after completing wave II as a Zigzag correction within the 50%–61.8% Fibonacci retracement zone. A confirmed breakout above the Bullish Level underscores a strong impulsive phase, consistent with Elliott Wave Theory's expectations for wave III. The immediate target price stands at $6.17. Traders are advised to align long entry positions with this advancing wave count to capitalize on DOT's potential upside.

Trading Strategies
Primary Strategy

✅ Swing Traders (Short-Term)
Entry Signal: A confirmed breakout above $4.40 (Bullish Level) suggests the beginning of wave III.

Risk Management

🟥 Stop Level: A drop below the red invalidation zone voids the current Elliott Wave structure.
DOTUSD-Day-Crypto-Ch...


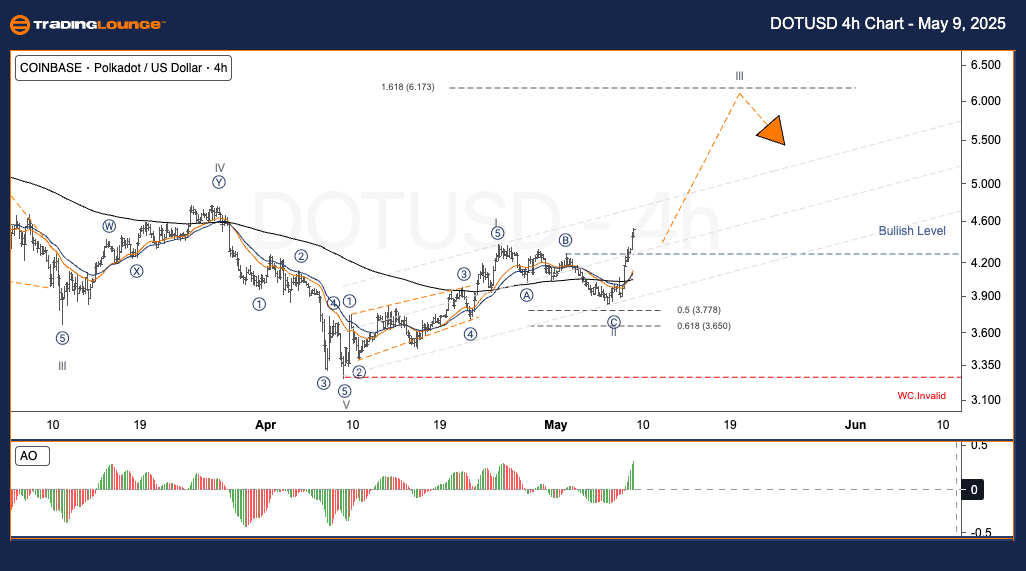
DOTUSD Elliott Wave Analysis – TradingLounge H4 Chart

Polkadot/U.S. Dollar (DOTUSD) H4 Chart Analysis

DOTUSD Elliott Wave Technical Analysis

Function: Trend Continuation

Mode: Motive

Structure: Impulse

Current Wave Position: Wave 3

Next Higher Degree Direction: Uptrend

Wave Cancel Invalid Level: Below Support Zone

DOTUSD Trading Strategy – H4 Chart

DOTUSD continues its upward trend following a Zigzag correction completing wave II near a significant Fibonacci support area (50%–61.8%). The price has clearly broken above the Bullish Level, confirming the progression into wave III. With a projected short-term price target of $6.17, traders can utilize this structure to plan strategic buy entries in alignment with the broader bullish wave.

Trading Strategies
Primary Strategy

✅ Swing Traders (Short-Term)
Entry Signal: A break above the $4.40 Bullish Level affirms wave III’s start.

Risk Management

🟥 Stop Level: A decline beneath the red invalidation line nullifies the wave projection.

Technical Analyst: Kittiampon Somboonsod, CEWA

Source: Visit Tradinglounge.com and learn from the Experts. Join TradingLounge Here 

Previous: THETAUSD Elliott Wave Technical Analysis

VALUE Offer - Buy 1 Month & Get 3 Months!Click here

Access 7 Analysts Over 200 Markets Covered. Chat Room With Support

DOTUSD-4h-Crypto-Cha...

Related

GX Uranium ETF Elliott Wave Analysis: Exploring Bullish Trends, Uranium Sector Growth, and Clean Energy Investment Opportunities

GX Uranium ETF Elliott Wave Analysis: Exploring Bullish Trends, Uranium Sector Growth, and Clean Energy Investment Opportunities

The GX Uranium ETF (URA) offers exposure to the growing uranium sector, capitalizing on increasing n...

Read More >
Our detailed U.S.Dollar /Canadian Dollar (USD/CAD) Forex Elliott Wave Technical Analysis: Market Dynamics for this Currency Pair.

Our detailed U.S.Dollar /Canadian Dollar (USD/CAD) Forex Elliott Wave Technical Analysis: Market Dynamics for this Currency Pair.

Our detailed USD/CAD Elliott Wave analysis offers valuable insights into the current market dynamics...

Read More >
Unlocking ASX Trading Success: MACQUARIE GROUP LIMITED - MQG Elliott Wave Analysis & Elliott Wave Technical Forecast

Unlocking ASX Trading Success: MACQUARIE GROUP LIMITED - MQG Elliott Wave Analysis & Elliott Wave Technical Forecast

Our latest ASX MQG Elliott Wave analysis provides insights into Macquarie Group Limited's stock ...

Read More >
Current Market Structure and Trading Strategies for MCD: McDonald’s Corp. Stocks Elliott Wave Technical Analysis

Current Market Structure and Trading Strategies for MCD: McDonald’s Corp. Stocks Elliott Wave Technical Analysis

Get comprehensive insights into McDonald's stock with our detailed Elliott Wave analysis. Learn ...

Read More >
Exploring ASX Trading Success: ASX LIMITED – ASX Stock Analysis & Elliott Wave Technical Forecast

Exploring ASX Trading Success: ASX LIMITED – ASX Stock Analysis & Elliott Wave Technical Forecast

Dive deep into the financial waters of ASX Limited with our detailed analysis. Leveraging Elliott Wa...

Read More >
Unleash Profits: Elliott Wave Analysis & Strategies for SP500, NASDAQ 100, RUSSELL 2000, DAX 40, FTSE 100, ASX 200

Unleash Profits: Elliott Wave Analysis & Strategies for SP500, NASDAQ 100, RUSSELL 2000, DAX 40, FTSE 100, ASX 200

Stock Market Indices Overview: S&P 500, SPY, NASDAQ 100, QQQ, RUSSELL 2000, DAX 40, FTSE 100, ASX 20...

Read More >

Buy 1 Month

Get 3 Months!

Special Offer:

Trade Recommendations

Unleash the power of deversified trading with our comprehensive portfolio, covering:

  • Stock Trades
  • Crypto Trades
  • Forex Trades
  • Commodity Trades
Elliott Wave Analysis

Gain a competive edge with expert insights in to:

  • Global Indices
  • US Stocks & ASX Stocks
  • Forex & Crypto
  • Commodities
Top-Notch Trading Tools

Equip yourself with the tools of success:

  • Social Chat
  • Elliott Wave Algorithm
  • Screener
  • TradingLevels
  • Trading Game
7 Elliott Wave Analysts

Stay ahead of the market with daily charts and insightful videos
-Your secret to strategic trading!

JOIN HERE


Welcome to TradingLounge (ASIC A.R.No. 321187), specialists in trades, trading education and technical analysis, covering stocks, indices, commodities, forex and cryptocurrencies.

When you join TradingLounge you have access to everything we offer, including trade tools, educational content and a social platform to chat with like-minded investors.

Read more

@Copyright 2024 by tradinglounge.com

Contact Us

Australian no: 02 4787 6020

International no: +61 (2) 47876020

Pay with:

Find us on