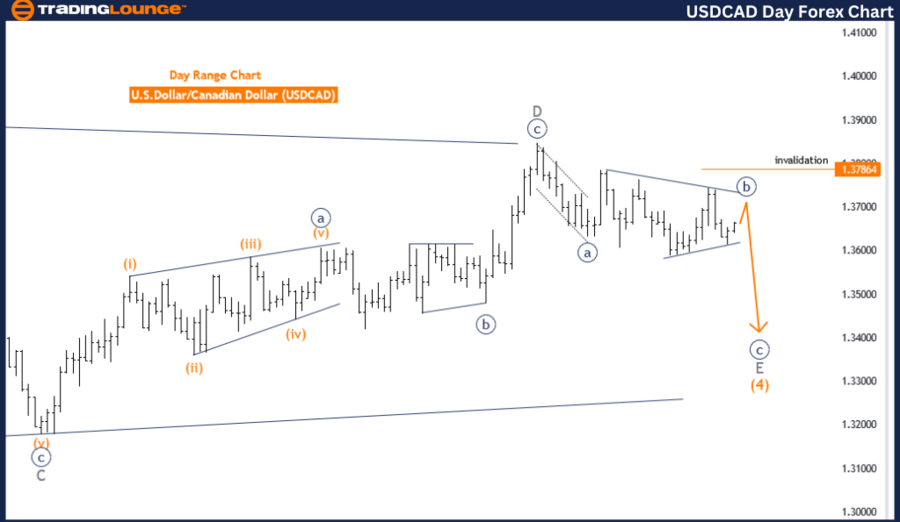
USDCAD Elliott Wave Analysis Trading Lounge Day Chart
U.S.Dollar /Canadian Dollar (USD/CAD) Day Chart Analysis
USD/CAD Elliott Wave Technical Analysis
FUNCTION: Counter Trend
MODE: Corrective
STRUCTURE: Navy Blue Wave B
POSITION: Gary Wave E
DIRECTION NEXT LOWER DEGREES: navy blue wave C
DETAILS: Navy blue wave B of E still is in play and looking near to end.
Wave Cancel invalid level: 1.37864
The USD/CAD Elliott Wave Analysis on the day chart focuses on the counter-trend movements using the Elliott Wave Principle to interpret market behavior. This analysis categorizes the function as counter-trend, indicating that the current price movements are against the prevailing trend. The mode is corrective, suggesting the market is experiencing a temporary retracement or consolidation rather than a continuation of the main trend.
The wave structure under scrutiny is navy blue wave B, which forms part of a larger corrective pattern within gary wave E. This specific positioning of navy blue wave B within gary wave E signifies that the market is in an intermediate corrective phase. Upon the completion of this phase, the market is anticipated to transition into navy blue wave C, continuing the broader corrective sequence.
The analysis details that navy blue wave B of gary wave E remains active and is approaching its conclusion. This implies that the market is in the final stages of this intermediate corrective wave. The completion of navy blue wave B will pave the way for the initiation of navy blue wave C, furthering the corrective pattern before the market potentially resumes its primary trend direction.
An important aspect of this analysis is the invalidation level set at 1.37864. This level is crucial for traders and analysts as it acts as a benchmark for the validity of the current wave count. If the market price reaches or surpasses this level, the existing wave analysis would be invalidated, indicating that the expected wave structure is no longer applicable. This would necessitate a reevaluation of the wave patterns and an adjustment of trading strategies.
In summary, the USD/CAD Elliott Wave Analysis on the day chart identifies the market as being in a corrective phase within a counter-trend. The active navy blue wave B of gary wave E is nearing completion, which will lead to the development of navy blue wave C. The invalidation level at 1.37864 is essential for maintaining the validity of the current wave count, ensuring that market strategies can be adapted if the price reaches this threshold. This analysis aids traders in anticipating market movements and adjusting their strategies accordingly based on the Elliott Wave patterns.
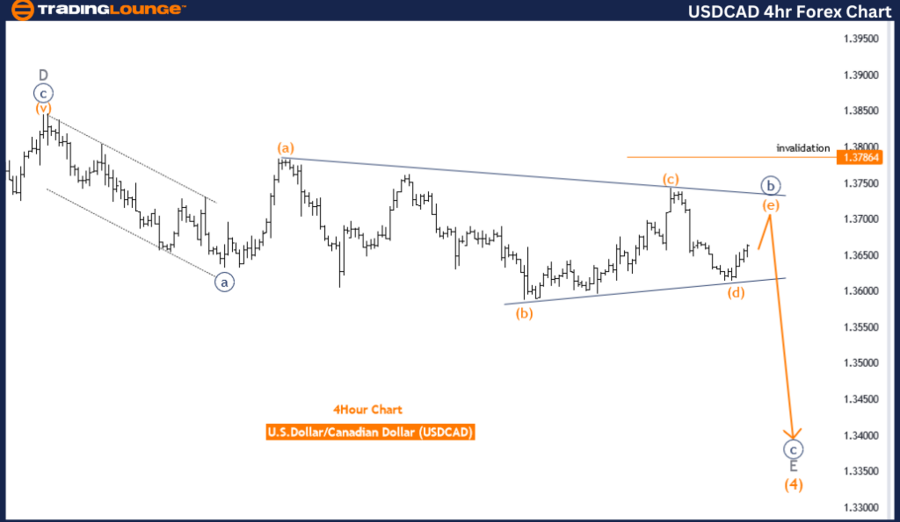
USDCAD Elliott Wave Analysis Trading Lounge 4-Hour Chart,
U.S.Dollar /Canadian Dollar (USD/CAD) 4 Hour Chart Analysis
USD/CAD Elliott Wave Technical Analysis
FUNCTION: Counter Trend
MODE: Corrective
STRUCTURE: Navy Blue Wave B
POSITION: Gary Wave E
DIRECTION NEXT LOWER DEGREES: navy blue wave C
DETAILS: Navy blue wave B of E still is in play and looking near to end.
Wave Cancel invalid level: 1.37864
The USD/CAD Elliott Wave Analysis on the 4-hour chart focuses on the counter-trend movements, employing the Elliott Wave Principle to interpret market behavior. This analysis categorizes the function as a counter-trend, indicating that the current price movements are against the prevailing trend. The mode is corrective, suggesting the market is undergoing a temporary retracement or consolidation rather than a continuation of the main trend.
The wave structure under analysis is navy blue wave B, which is part of a larger corrective pattern within gary wave E. This specific position of navy blue wave B within gary wave E signifies that the market is in an intermediate corrective phase. Once this phase completes, the market is expected to transition to navy blue wave C, resuming the overall corrective pattern's next phase.
The details of the analysis indicate that navy blue wave B of gary wave E is still active and nearing its completion. This suggests that the market is in the final stages of this intermediate corrective wave. The completion of navy blue wave B will set the stage for the initiation of navy blue wave C, which will further the corrective sequence before the market potentially resumes its primary trend direction.
An important aspect of this analysis is the invalidation level set at 1.37864. This level is crucial for traders and analysts as it serves as a benchmark for the validity of the current wave count. If the market price reaches or exceeds this level, the current wave analysis would be invalidated, implying that the expected wave structure is no longer applicable. This would necessitate a reevaluation of the wave patterns and an adjustment of trading strategies.
In summary, the USD/CAD Elliott Wave Analysis on the 4-hour chart identifies the market as being in a corrective phase within a counter-trend. The active navy blue wave B of gary wave E is nearing completion, which will lead to the development of navy blue wave C. The invalidation level at 1.37864 is critical for maintaining the validity of the current wave count, ensuring that market strategies can be adapted if the price reaches this threshold. This analysis helps traders anticipate market movements and adjust their strategies accordingly based on the Elliott Wave patterns.
Technical Analyst: Malik Awais
Source: visit Tradinglounge.com and learn From the Experts Join TradingLounge Here
Previous: New Zealand Dollar/U.S.Dollar(NZDUSD) Elliott Wave Technical Analysis
Special Trial Offer - 0.76 Cents a Day for 3 Months! Click here
Access 7 Analysts Over 170 Markets Covered. Chat Room With Support