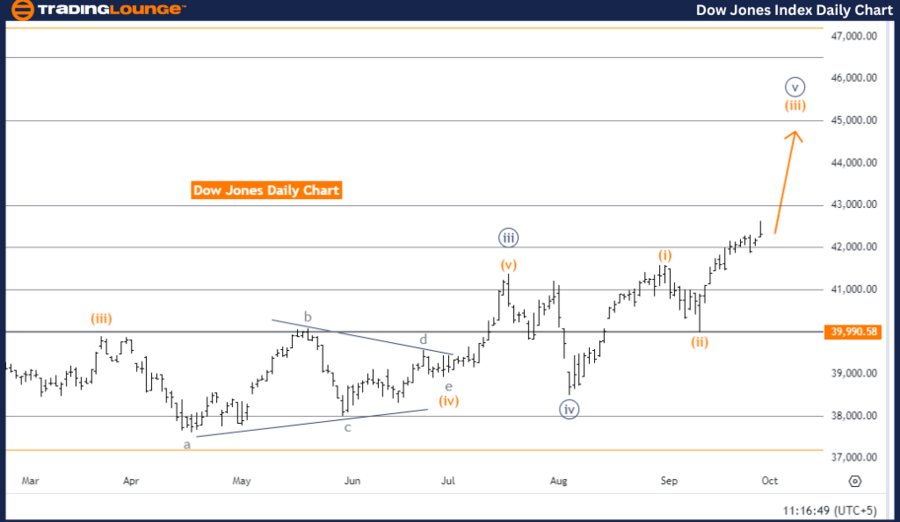
DOW JONES - DJI Elliott Wave Analysis | Trading Lounge Day Chart
DOW JONES - DJI Daily Chart Analysis
DOW JONES - DJI Elliott Wave Technical Analysis
FUNCTION: Bullish Trend
MODE: Impulsive
STRUCTURE: Orange Wave 3
POSITION: Navy Blue Wave 5
DIRECTION NEXT HIGHER DEGREES: Orange Wave 3 (in progress)
DETAILS: Orange Wave 2 is complete, with Orange Wave 3 now in progress.
Cancel Invalid Level: 39,990.58
The Dow Jones (DJI) daily chart Elliott Wave analysis shows a strong bullish trend, suggesting a continued upward market movement. The trend is impulsive, indicating that the market is advancing sharply. Currently, the focus is on Orange Wave 3, a crucial phase within the larger bullish structure.
The market is positioned in Navy Blue Wave 5, supporting the continuation of the upward trend. Orange Wave 3 has just begun following the completion of Orange Wave 2, which served as a corrective phase. With this phase behind, the market is expected to maintain bullish momentum as Orange Wave 3 unfolds.
In Elliott Wave theory, Wave 3 is typically the most powerful phase in an impulsive trend, suggesting further upward movement for the Dow Jones index. The combination of an impulsive trend and the early stages of Wave 3 highlights the potential for continued gains in the market.
An invalidation level is set at 39,990.58. If the market drops below this point, the current Elliott Wave analysis would be invalid, indicating the bullish structure is no longer applicable and a reassessment would be required. Traders should monitor this critical level closely to confirm the continuation of the bullish trend.
Summary
The Dow Jones daily chart analysis confirms a bullish trend, with Orange Wave 3 driving the upward movement. Traders should watch the 39,990.58 invalidation level closely. As long as the market remains above this point, the bullish outlook holds, with further gains expected.
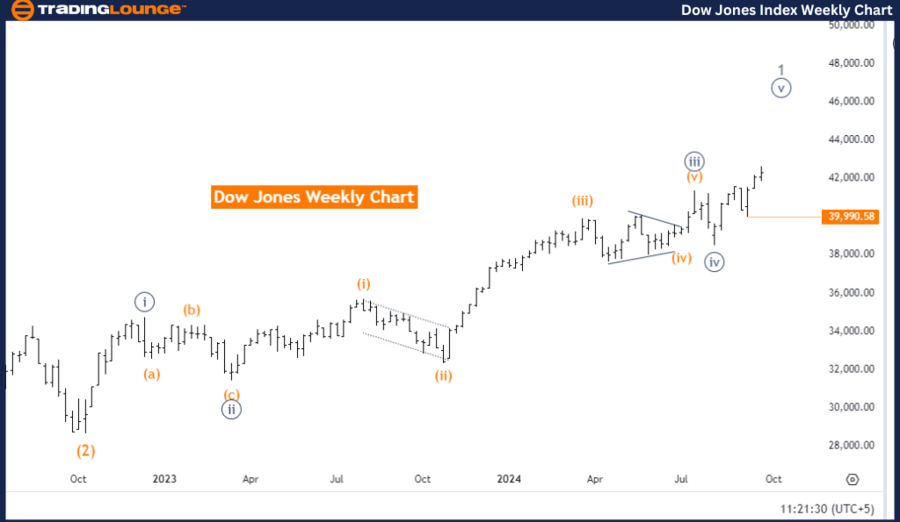
DOW JONES - DJI Elliott Wave Analysis | Trading Lounge Weekly Chart
DOW JONES - DJI Elliott Wave Technical Analysis
FUNCTION: Bullish Trend
MODE: Impulsive
STRUCTURE: Navy Blue Wave 5
POSITION: Gray Wave 1
DIRECTION NEXT LOWER DEGREES: Gray Wave 2
DETAILS: Navy Blue Wave 4 is complete, with Navy Blue Wave 5 now in progress.
Cancel Invalid Level: 39,990.58
The weekly chart for the Dow Jones (DJI) Elliott Wave analysis indicates a bullish trend, showing upward momentum. The trend mode remains impulsive, highlighting strong market activity. The primary wave under analysis is Navy Blue Wave 5, which plays a key role in this ongoing bullish trend.
The market is currently positioned in Gray Wave 1, part of a broader upward sequence. Following the completion of Navy Blue Wave 4, the analysis suggests that Navy Blue Wave 5 is in progress, continuing to push the market upward. Wave 5 often represents the final leg in an impulsive cycle, suggesting potential further gains before any major correction.
The next lower degree movement will likely be Gray Wave 2, typically a corrective phase after Gray Wave 1 concludes. For now, however, Gray Wave 1 is still unfolding, with the bullish momentum expected to continue through Navy Blue Wave 5.
The invalidation level for this analysis is also set at 39,990.58. Should the market fall below this level, the current bullish wave structure would be invalidated, requiring a reassessment of the trend. Traders should watch this key level to ensure the bullish outlook remains intact.
Summary
The Dow Jones weekly chart Elliott Wave analysis shows a continued bullish trend driven by Navy Blue Wave 5. The market is progressing through Gray Wave 1, and traders should closely monitor the 39,990.58 invalidation level to confirm the bullish momentum continues. Further gains are anticipated as long as this level holds.
Technical Analyst: Malik Awais
Source: visit Tradinglounge.com and learn From the Experts Join TradingLounge Here
Previous: S&P/ASX 200 Index Elliott Wave Technical Analysis
VALUE Offer - Buy 1 Month & Get 3 Months!Click here
Access 7 Analysts Over 200 Markets Covered. Chat Room With Support