ASX: XERO LIMITED - XRO Elliott Wave Technical Analysis TradingLounge

Our updated Elliott Wave analysis for XERO LIMITED (ASX:XRO) focuses on its current trajectory within the Australian Stock Exchange (ASX). Based on our technical insights, ASX:XRO is projected to climb further as it progresses through an unfolding Diagonal pattern.

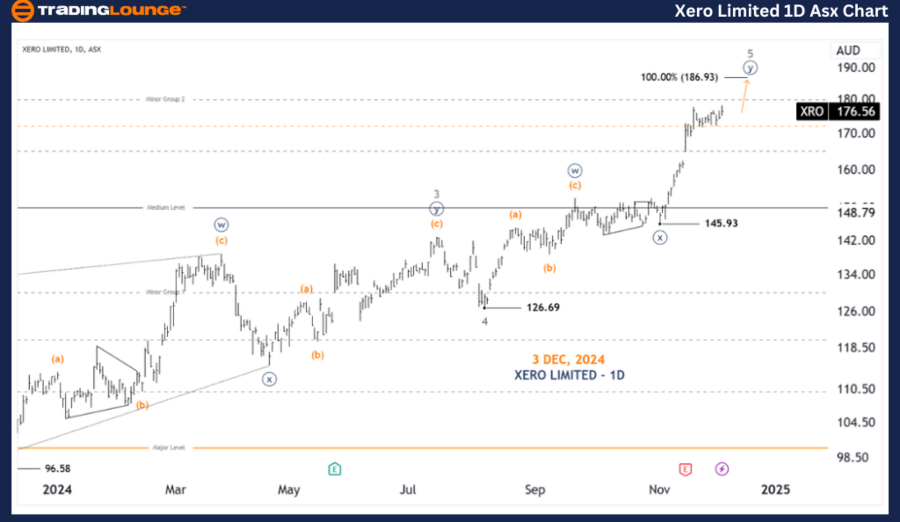
ASX: XERO LIMITED - XRO 1D Chart (Semilog Scale) Analysis

Function: Major trend (Minor degree, gray)

Mode: Motive

Structure: Diagonal

Position: Wave ((y))-navy of Wave 5-grey

Key Details:

  • The price action is within the 5-grey wave, part of a larger Diagonal labeled from 1-grey to 5-grey.
  • The internal structure of this wave follows a 3-3-3-3-3 subwave pattern.
  • The 5-grey wave is projected to climb higher, targeting approximately 186.93, forming a double zigzag labeled ((w))((x))((y))-navy.
  • Invalidation point: 145.93. If the price falls below this level, the current wave count becomes invalid.

XERO-LIMITED-1d-asx-...


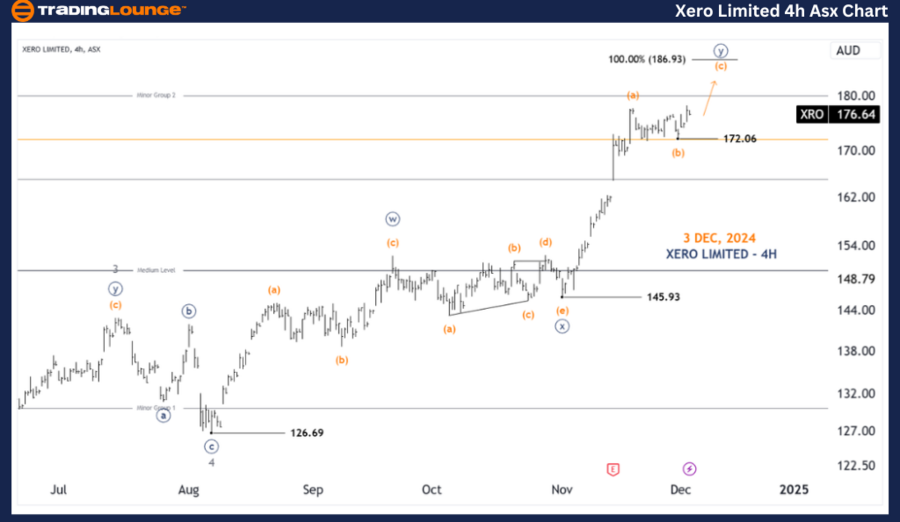
ASX: XERO LIMITED - XRO 4-Hour Chart Analysis

Function: Major trend (Minute degree, navy)

Mode: Motive

Structure: Diagonal

Position: Wave (c)-orange of Wave ((y))

Key Details:

  • Within the 5-grey wave, a closer examination reveals it as a Double Zigzag labeled ((w))((x))((y))-navy.
  • The ((y))-navy wave, being part of this zigzag, is itself subdivided into (a)(b)(c)-orange.
  • The (c)-orange wave is likely to continue its upward movement toward the 186.93 area.
  • Invalidation point: 172.06. Should the price exceed this level, it would signal a shift away from the Diagonal pattern into an alternative wave count scenario.

Technical Analyst: Hua (Shane) Cuong, CEWA-M (Master’s Designation).

Source: visit Tradinglounge.com and learn From the Experts Join TradingLounge Here 

See Previous: ASX: WOOLWORTHS GROUP LIMITED - WOW Elliott Wave Technical Analysis  

VALUE Offer - Buy 1 Month & Get 3 Months!Click here

Access 7 Analysts Over 200 Markets Covered. Chat Room With Support

XERO-LIMITED-4h-asx-...


Conclusion

Our analysis of ASX: XERO LIMITED (ASX:XRO) provides a detailed outlook on both long-term trends and short-term movements. By highlighting specific price targets like 186.93 and key invalidation points such as 145.93 and 172.06, we aim to offer actionable insights for traders. These critical levels validate or refute the wave count, improving the reliability of our technical perspective. Our goal remains to deliver the most accurate and professional analysis of market trends for informed decision-making.

Related

ADANI PORTS and SEZ Indian Stocks Elliott Wave Technical Analysis: Share Price Insights, Market Trends, and Forecasts

ADANI PORTS and SEZ Indian Stocks Elliott Wave Technical Analysis: Share Price Insights, Market Trends, and Forecasts

Elliott Wave analysis of ADANI PORTS, focusing on key technical insights, price predictions, and pot...

Read More >
U.S.Dollar/Japanese Yen(USDJPY) Forex - Elliottwave Technical analysis

U.S.Dollar/Japanese Yen(USDJPY) Forex - Elliottwave Technical analysis

Elliott Wave analysis of the USDJPY currency pair, providing traders with a detailed forecast and in...

Read More >
Alphabet Inc. (GOOGL) Elliott Wave Analysis: Stock Forecast, Price Trends, and Investment Strategies for Better Trading Decisions

Alphabet Inc. (GOOGL) Elliott Wave Analysis: Stock Forecast, Price Trends, and Investment Strategies for Better Trading Decisions

Elliott Wave analysis of Alphabet Inc. (GOOGL), highlighting stock forecasts, potential resistance l...

Read More >
Elliott Wave Analysis for NASDAQ 100 & Tech Stocks: Insights & Strategies for NDX, SP500, and Major Companies

Elliott Wave Analysis for NASDAQ 100 & Tech Stocks: Insights & Strategies for NDX, SP500, and Major Companies

This summary provides a comprehensive Elliott Wave analysis of the NASDAQ 100 (NDX) and major techno...

Read More >
Comprehensive Elliott Wave Analysis: S&P 500, NASDAQ 100, DAX 40, and More - June 2024 Market Insights

Comprehensive Elliott Wave Analysis: S&P 500, NASDAQ 100, DAX 40, and More - June 2024 Market Insights

Today's analysis covers key stock market indices including the S&P 500, NASDAQ 100, Russell 2000...

Read More >
DJI Elliott Wave Technical Analysis: Dow Jones Index Market Analysis signals a bullish trend, with Wave Driving Upward Momentum

DJI Elliott Wave Technical Analysis: Dow Jones Index Market Analysis signals a bullish trend, with Wave Driving Upward Momentum

The Dow Jones Elliott Wave analysis signals a bullish trend, with Orange Wave 3 and Navy Blue Wave 5...

Read More >

Buy 1 Month

Get 3 Months!

Special Offer:

Trade Recommendations

Unleash the power of deversified trading with our comprehensive portfolio, covering:

  • Stock Trades
  • Crypto Trades
  • Forex Trades
  • Commodity Trades
Elliott Wave Analysis

Gain a competive edge with expert insights in to:

  • Global Indices
  • US Stocks & ASX Stocks
  • Forex & Crypto
  • Commodities
Top-Notch Trading Tools

Equip yourself with the tools of success:

  • Social Chat
  • Elliott Wave Algorithm
  • Screener
  • TradingLevels
  • Trading Game
7 Elliott Wave Analysts

Stay ahead of the market with daily charts and insightful videos
-Your secret to strategic trading!

JOIN HERE


Welcome to TradingLounge (ASIC A.R.No. 321187), specialists in trades, trading education and technical analysis, covering stocks, indices, commodities, forex and cryptocurrencies.

When you join TradingLounge you have access to everything we offer, including trade tools, educational content and a social platform to chat with like-minded investors.

Read more

@Copyright 2024 by tradinglounge.com

Contact Us

Australian no: 02 4787 6020

International no: +61 (2) 47876020

Pay with:

Find us on