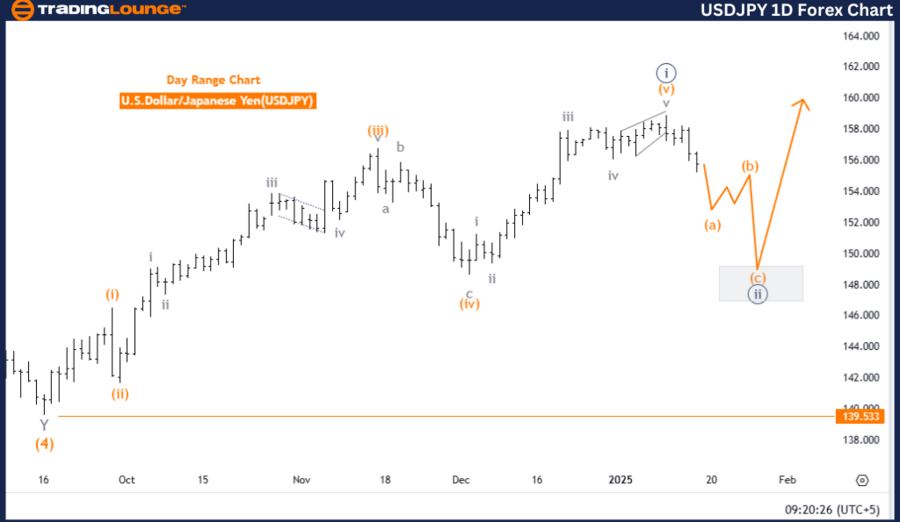
U.S. Dollar / Japanese Yen (USDJPY) Elliott Wave Analysis - Trading Lounge Day Chart
USDJPY Elliott Wave Technical Analysis
Function: Counter Trend
Mode: Corrective
Structure: Navy Blue Wave 2
Position: Gray Wave 1
Direction Next Higher Degrees: Navy Blue Wave 3
Details: Navy blue wave 1 appears completed; navy blue wave 2 is unfolding.
Wave Cancel Invalidation Level: 139.533
The USDJPY pair is currently in a counter-trend corrective phase, as highlighted by the Elliott Wave Analysis on the daily chart. This phase, identified as navy blue wave 2, represents a retracement following the completion of navy blue wave 1, an impulsive movement. This corrective stage is expected to act as a setup for the subsequent bullish trend, driven by navy blue wave 3.
The invalidation level for this wave analysis is 139.533. A drop below this point would invalidate the current Elliott Wave scenario and require a reassessment of the wave structure. This benchmark plays a pivotal role in maintaining the integrity of the analysis and in monitoring the corrective phase’s progression.
Summary
- USDJPY is in navy blue wave 2, undergoing a corrective phase after completing navy blue wave 1.
- The corrective wave is expected to pave the way for navy blue wave 3, signaling a return to the broader bullish trend.
- The invalidation level of 139.533 is critical for confirming the current analysis or signaling a need for adjustment.
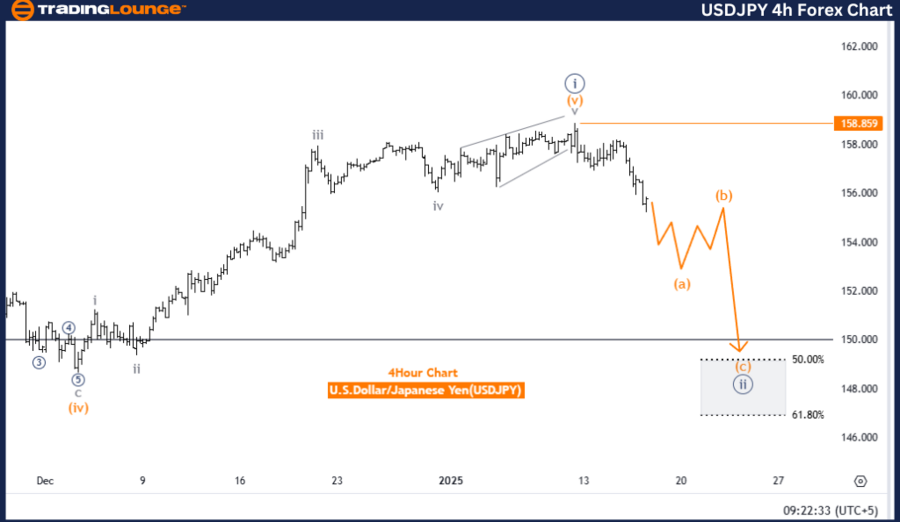
U.S. Dollar / Japanese Yen (USDJPY) Elliott Wave Analysis - Trading Lounge 4-Hour Chart
USDJPY Elliott Wave Technical Analysis
Function: Counter Trend
Mode: Impulsive
Structure: Orange Wave A
Position: Navy Blue Wave 2
Direction Next Higher Degrees: Orange Wave B
Details: Navy blue wave 1 appears completed; orange wave A of 2 is currently unfolding.
Wave Cancel Invalidation Level: 158.859
On the 4-hour chart, the USDJPY is showing a counter-trend impulsive structure, represented by orange wave A. This wave forms part of the navy blue wave 2 corrective phase, indicating a temporary pullback within the larger bullish trend. The ongoing orange wave A serves as the initial segment of this correction, setting the stage for orange wave B, the subsequent phase.
The invalidation level for orange wave A is set at 158.859. A price movement beyond this level would invalidate the current wave scenario, requiring adjustments to the analysis. This level is essential for maintaining the reliability of the Elliott Wave framework.
Summary
- USDJPY is progressing through orange wave A of navy blue wave 2, marking the first stage of the corrective cycle.
- Completion of navy blue wave 1 initiated the current retracement, with orange wave B anticipated as the next phase.
- The invalidation level at 158.859 is a crucial point to confirm or adjust the wave analysis.
Technical Analyst: Malik Awais
Source: visit Tradinglounge.com and learn From the Experts Join TradingLounge Here
Previous: EURUSD Elliott Wave Technical Analysis
VALUE Offer - Buy 1 Month & Get 3 Months!Click here
Access 7 Analysts Over 200 Markets Covered. Chat Room With Support