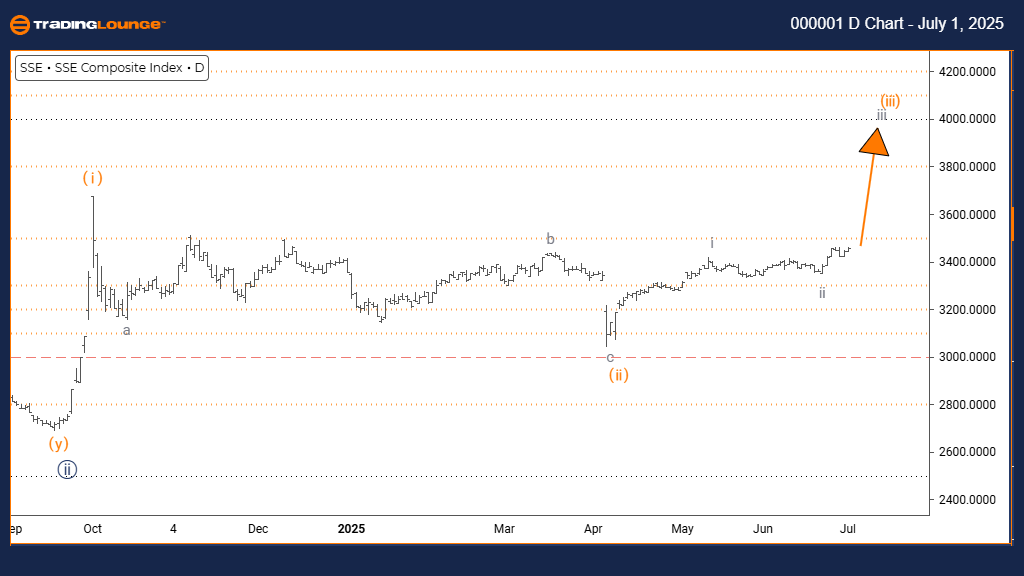
Shanghai Composite Elliott Wave Analysis – TradingLounge Daily Chart
Shanghai Composite Elliott Wave Technical Overview
Function: Bullish Market Movement
Mode: Impulsive Wave Progression
Structure: Gray Wave 3 Formation
Position: Orange Wave 3 Development
Direction (Higher Degrees): Gray Wave 3 Initiated
Details: Completion of Gray Wave 2 confirmed; Gray Wave 3 currently unfolding.
Daily Chart Summary
The latest Elliott Wave analysis of the Shanghai Composite Index on the daily chart highlights an ongoing bullish trend. The market is advancing within an impulsive structure, indicating strong upward momentum. The active formation is identified as Gray Wave 3, within the larger Orange Wave 3, signaling a robust phase of market growth in this bullish cycle.
Wave 2 to 3 Transition
Gray Wave 2 has concluded its corrective phase, initiating Gray Wave 3. In Elliott Wave theory, this wave often carries the most pronounced price increases, driven by growing investor confidence and high trading volumes.
Technical Outlook
Now that Gray Wave 3 has started following the end of Wave 2, the Shanghai Composite Index shows potential for further gains. The impulsive nature of this wave suggests continued buying interest and a likely short- to mid-term rally. Traders should observe momentum levels and any key resistance zones for signs of trend extension.
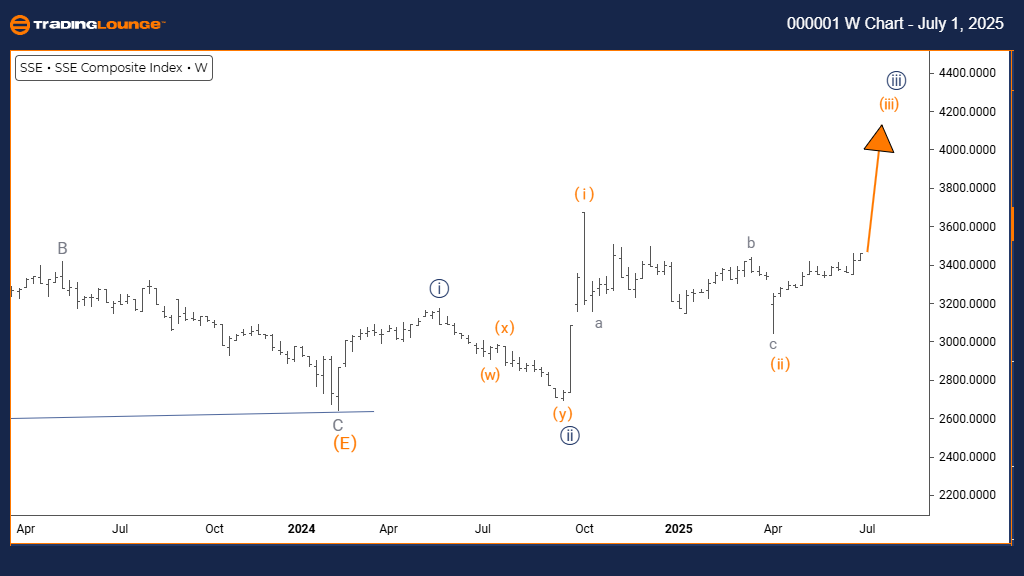
Shanghai Composite Elliott Wave Analysis – TradingLounge Weekly Chart
Shanghai Composite Elliott Wave Technical Overview
Function: Bullish Market Phase
Mode: Impulsive Wave Progression
Structure: Orange Wave 3 Formation
Position: Navy Blue Wave 3 Development
Direction (Lower Degrees): Orange Wave 4 Expected
Details: Orange Wave 2 has completed; Orange Wave 3 now in motion.
Weekly Chart Summary
The weekly Elliott Wave analysis of the Shanghai Composite supports a strong bullish projection. Price action continues in impulsive mode, suggesting a steady upward trajectory. The current active wave is Orange Wave 3, aligned within the broader structure of Navy Blue Wave 3. Historically, this wave signals powerful bullish phases with extended price rallies.
Wave 2 to 3 Shift
Following the confirmed end of Orange Wave 2, the index has moved into Orange Wave 3. This wave is typically marked by sharp price gains and reduced pullbacks. After the culmination of this wave, traders should anticipate Orange Wave 4 to begin as the next lower-degree correction.
Technical Outlook
With Orange Wave 3 in progress and bullish momentum apparent, the Shanghai Composite is in a clear uptrend. The market structure favors continued upward movement unless a break below the wave invalidation point occurs. Until such a shift, the bullish forecast remains intact.
Technical Analyst: Malik Awais
Source: Visit Tradinglounge.com and learn from the Experts. Join TradingLounge Here
Previous: DJI Index Elliott Wave Technical Analysis
VALUE Offer - $1 for 2 Weeks then $29 a month!Click here
Access 7 Analysts Over 200 Markets Covered. Chat Room With Support