10Jun

Hang Seng Elliott Wave Forecast: Wave 3 Active, Daily & Weekly Strategies With 19215 Invalidation Alpha

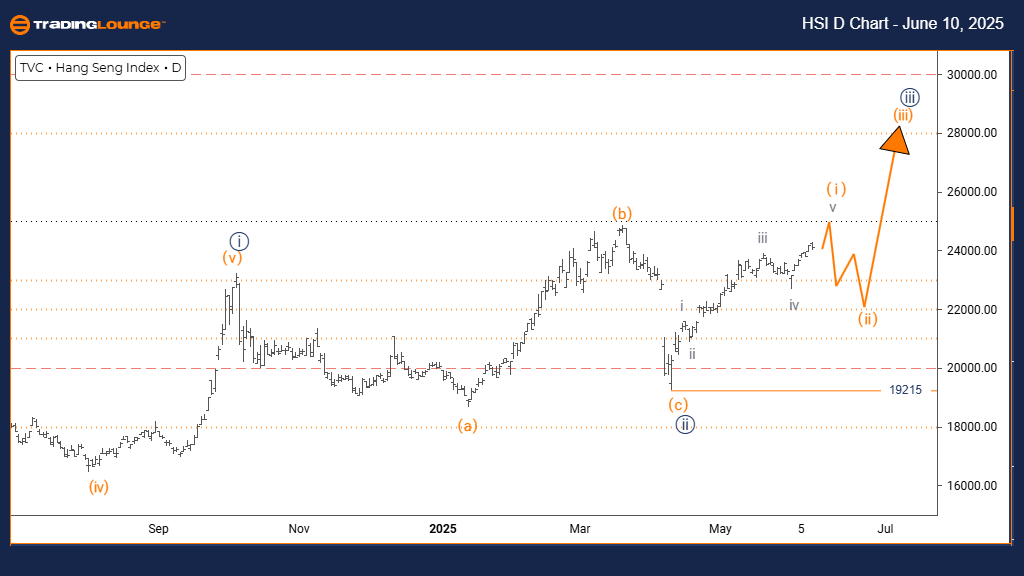
Hang Seng Index – Elliott Wave Analysis Day Chart

Hang Seng Index Wave Technical Analysis

FUNCTION: Trend

MODE: Impulsive

STRUCTURE: Orange Wave 1

POSITION: Navy Blue Wave 3

DIRECTION NEXT LOWER DEGREES: Orange Wave 2

DETAILS: Navy Blue Wave 2 appears complete; Orange Wave 1 of 3 is now in progress.

Wave Cancellation Invalidation Level: 19215

The daily Elliott Wave analysis for the Hang Seng Index indicates a bullish market trend with impulsive characteristics. The current wave structure suggests that Orange Wave 1 is underway as part of the broader Navy Blue Wave 3, signaling the beginning of a potential major upward cycle.

Navy Blue Wave 2 has likely ended its corrective phase, setting the stage for Orange Wave 1 of Navy Blue Wave 3. This development marks the start of a new upward impulse within a strong bullish trend. The next anticipated movement in the wave sequence is Orange Wave 2—a corrective pullback typically following an impulsive advance.

Traders should watch the 19215 level carefully. A move below this threshold would invalidate the current bullish wave structure and prompt a reevaluation of the market position. Until then, the trend remains firmly upward.

This setup places the Hang Seng Index in a favorable position for further gains. With Orange Wave 1 actively developing after the completion of Navy Blue Wave 2, the current phase suggests increased buying strength and further upside potential in the near term.

Hang-Seng-d-chart-10...


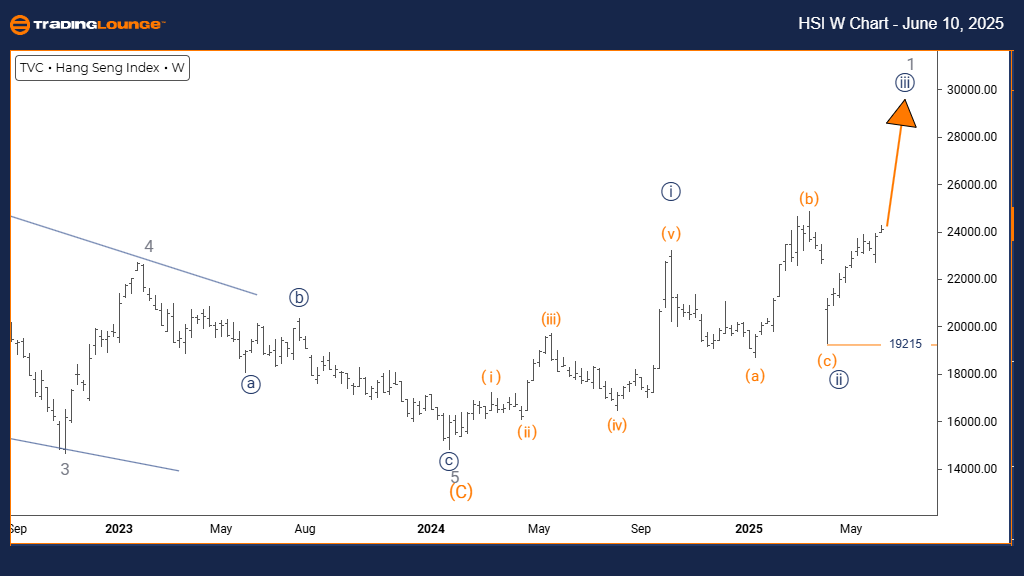
Hang Seng Index – Elliott Wave Analysis Weekly Chart

Hang Seng Index Wave Technical Analysis

FUNCTION: Trend

MODE: Impulsive

STRUCTURE: Navy Blue Wave 3

POSITION: Gray Wave 1

DIRECTION NEXT LOWER DEGREES: Navy Blue Wave

DETAILS: Navy Blue Wave 2 appears complete; Navy Blue Wave 3 is now developing.

Wave Cancellation Invalidation Level: 19215

The weekly Elliott Wave overview for the Hang Seng Index confirms a sustained bullish outlook, supported by impulsive price action. The index is currently forming Navy Blue Wave 3, part of the larger Gray Wave 1 structure. This stage is typically associated with strong bullish momentum and significant upward price moves.

The transition from Navy Blue Wave 2 to Wave 3 marks the beginning of one of the most aggressive phases in the Elliott Wave cycle. Investors can expect further internal developments within Navy Blue Wave 3 as this powerful uptrend unfolds.

The invalidation level remains at 19215. A close below this point would challenge the bullish wave setup and necessitate a revised analysis. As long as prices stay above this level, the current outlook supports continued strength.

In summary, the Hang Seng Index remains in a bullish phase with Navy Blue Wave 3 progressing. This configuration suggests ongoing market momentum, offering potential growth opportunities within the wider Gray Wave 1 pattern.

Technical Analyst: Malik Awais

Source: Visit Tradinglounge.com and learn from the Experts. Join TradingLounge Here 

Previous: Bovespa Elliott Wave Technical Analysis

VALUE Offer - Buy 1 Month & Get 3 Months!Click here

Access 7 Analysts Over 200 Markets Covered. Chat Room With Support

Hang-Seng-w-chart-10...

Related

Shanghai Composite Index Elliott Wave Technical Analysis with SSE Price Predictions, Market Trends, and Financial Insights

Shanghai Composite Index Elliott Wave Technical Analysis with SSE Price Predictions, Market Trends, and Financial Insights

This analysis provides a detailed Elliott Wave breakdown of the Shanghai Composite Index (SSE), high...

Read More >
Alphabet Inc. (GOOGL) Stock Prediction: GOOGL Elliott Wave Technical Analysis, Price Target, and Trading Strategy

Alphabet Inc. (GOOGL) Stock Prediction: GOOGL Elliott Wave Technical Analysis, Price Target, and Trading Strategy

In this detailed analysis of Alphabet Inc (GOOGL) stock, we apply Elliott Wave Theory to examine pri...

Read More >
British Pound/U.S.Dollar (GBPUSD) Elliott Wave Technical Analysis 11 January 24

British Pound/U.S.Dollar (GBPUSD) Elliott Wave Technical Analysis 11 January 24

British Pound/U.S.Dollar (GBPUSD) Elliott Wave Technical Analysis 11 January 24 provides an in-depth...

Read More >
ASX NEM Elliott Wave Forecast Reveals Bullish Newmont Price Targets, Key Invalidation Points, and Uptrend Strategy for Gold Stocks

ASX NEM Elliott Wave Forecast Reveals Bullish Newmont Price Targets, Key Invalidation Points, and Uptrend Strategy for Gold Stocks

This article provides an Elliott Wave-based technical analysis of Newmont Corporation (ASX: NEM), hi...

Read More >
VanEck Gold Miners ETF – GDX Elliott Wave Analysis: Bullish Impulse Wave, Price Target, Support and Resistance Levels

VanEck Gold Miners ETF – GDX Elliott Wave Analysis: Bullish Impulse Wave, Price Target, Support and Resistance Levels

Elliott Wave analysis of the VanEck Gold Miners ETF (GDX), focusing on the powerful rally phase iden...

Read More >
XRPUSD Elliott Wave Technical Analysis: Insight into Crypto Price News

XRPUSD Elliott Wave Technical Analysis: Insight into Crypto Price News

Delve into the Elliott Wave analysis for XRPUSD, revealing both counter-trend and trend-following pe...

Read More >

$1 for 2 Weeks

then $29 a month!

What a Special Offer!

Trade Recommendations

Unleash the power of deversified trading with our comprehensive portfolio, covering 250+ markets:

  • Stock Trades
  • Crypto Trades
  • Forex Trades
  • Commodity Trades
Elliott Wave Analysis

Gain a competitive edge with expert insights and AI-powered Elliott Wave charting into:

  • Global Indices
  • US Stocks & ASX Stocks
  • Forex & Crypto
  • Commodities
Top-Notch Trading Tools

Equip yourself with the tools of success:

  • Real-time Chat rooms
  • Elliott Wave Algorithm
  • Portfolio tools
  • TradingLevels
  • Screener
  • Trading Game
7 Elliott Wave Analysts

Stay ahead of the market with daily charts and insightful videos
Your secret to strategic trading!

JOIN HERE


Welcome to TradingLounge (ASIC A.R.No. 321187), specialists in trades, trading education and technical analysis, covering stocks, indices, commodities, forex and cryptocurrencies.

When you join TradingLounge you have access to everything we offer, including trade tools, educational content and a social platform to chat with like-minded investors.

Read more

@Copyright 2024 by tradinglounge.com

Contact Us

Australian no: 02 4787 6020

International no: +61 (2) 47876020

Pay with:

Find us on