USDJPY Elliott Wave Analysis - Trading Lounge Day Chart
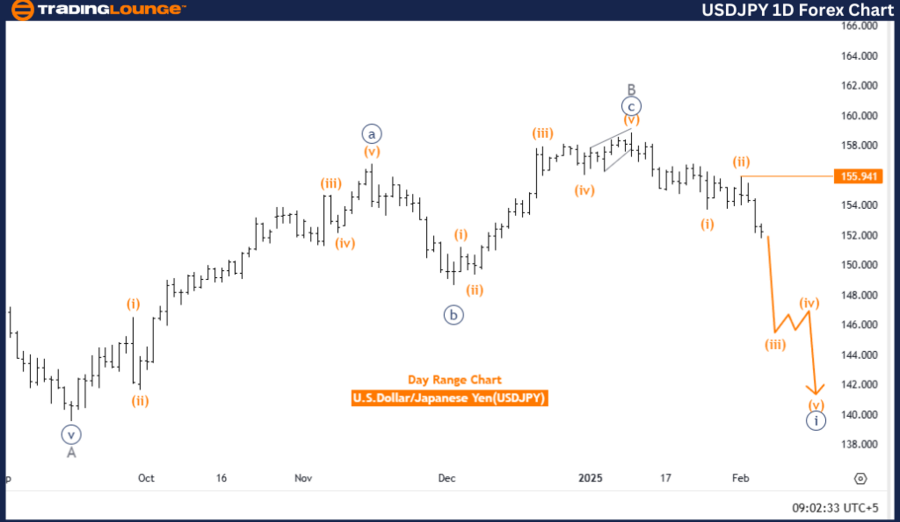
U.S. Dollar / Japanese Yen (USDJPY) Day Chart Analysis
USDJPY Elliott Wave Technical Analysis
- Function: Bearish Trend
- Mode: Impulsive
- Structure: Orange Wave 3
- Position: Navy Blue Wave 1
- Direction Next Higher Degrees: Orange Wave 4
- Details:
- The orange wave 2 of navy blue wave 1 appears completed.
- Orange wave 3 is now unfolding.
Wave Cancel Invalidation Level: 155.941
USDJPY Forex Pair Analysis Overview
The USDJPY Elliott Wave Analysis for the daily chart indicates a bearish trend, with the market currently in an impulsive phase. This phase signals strong downward momentum.
The structure is defined as orange wave 3, which is a part of the larger navy blue wave 1. This suggests that the market is in the early stages of a larger bearish cycle.
The completion of orange wave 2 marks the beginning of orange wave 3, which is expected to drive the price lower. Following this, the next anticipated phase is orange wave 4, signaling a corrective phase after the impulsive wave completes.
A crucial wave cancellation invalidation level is set at 155.941. If the price moves above this threshold, the current Elliott wave count would be invalidated, potentially altering the bearish outlook. Traders should closely monitor this level to confirm whether the downtrend continues.
Conclusion
The USDJPY daily chart analysis confirms a bearish trend with impulsive momentum, currently in orange wave 3 of navy blue wave 1. The completion of orange wave 2 has set the stage for further price declines.
The invalidation level at 155.941 is a critical reference for traders, indicating whether the bearish trend holds or if a potential reversal occurs. Once orange wave 3 completes, the market may enter orange wave 4, initiating a correction before the next trend continuation.
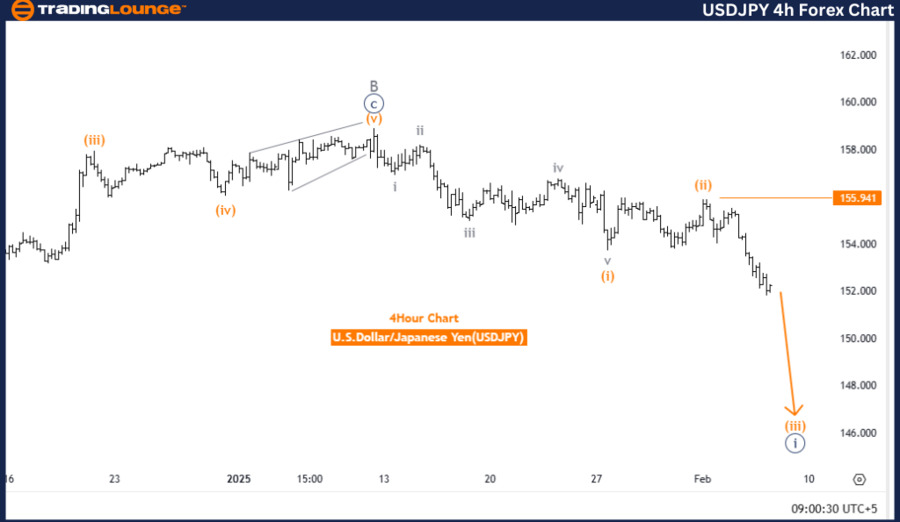
U.S. Dollar / Japanese Yen (USDJPY) 4-Hour Chart
USDJPY Elliott Wave Technical Analysis
- Function: Bearish Trend
- Mode: Impulsive
- Structure: Orange Wave 3
- Position: Navy Blue Wave 1
- Direction Next Lower Degrees: Orange Wave 3 (Started)
- Details:
- The orange wave 2 of navy blue wave 1 appears completed.
- Orange wave 3 is now unfolding.
Wave Cancel Invalidation Level: 155.941
USDJPY Currency Pair Analysis Overview
The USDJPY Elliott Wave Analysis for the 4-hour chart confirms a bearish trend. The market remains in an impulsive phase, indicating strong downward momentum.
The wave structure shows orange wave 3, which is part of a larger navy blue wave 1, confirming that the market is in the early stages of a broader downward movement.
The completion of orange wave 2 suggests that orange wave 3 has begun, pushing prices lower. The next lower degree also aligns with orange wave 3, reinforcing the continuation of the bearish trend in the short term.
A key level to watch is the wave cancellation invalidation level at 155.941. If the price rises above this level, the current Elliott wave structure would be invalidated, potentially reversing the bearish outlook. Traders should closely track this level to determine whether the downward trend will continue.
Conclusion
The USDJPY 4-hour chart analysis maintains a bearish trend with strong impulsive momentum, currently in orange wave 3 of navy blue wave 1. The completion of orange wave 2 has paved the way for further downside movement.
The invalidation level at 155.941 remains a key technical reference. If prices remain below this level, the bearish trend is likely to persist. However, if it is breached, a potential reversal could emerge. The downward pressure is expected to continue, reinforcing the ongoing trend.
Technical Analyst: Malik Awais
Source: visit Tradinglounge.com and learn From the Experts Join TradingLounge Here
Previous: EURUSD Elliott Wave Technical Analysis
VALUE Offer - Buy 1 Month & Get 3 Months!Click here
Access 7 Analysts Over 200 Markets Covered. Chat Room With Support