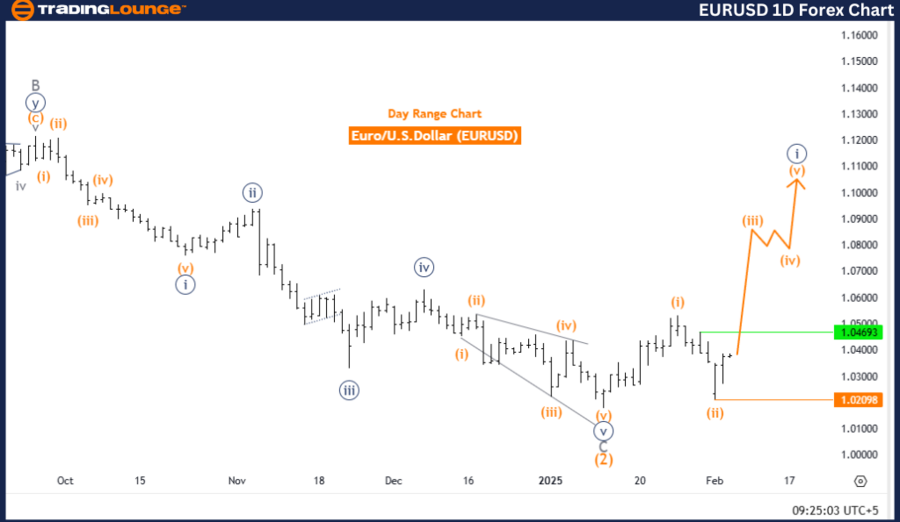
EURUSD Elliott Wave Analysis – Trading Lounge Day Chart
Euro/U.S. Dollar (EURUSD) Day Chart Analysis
EURUSD Elliott Wave Technical Analysis
Function: Bullish Trend
Mode: Impulsive
Structure: Orange Wave 3
Position: Navy Blue Wave 1
Next Higher Degree Direction: Orange Wave 3 (In Progress)
Details:
Wave Invalidation Level: 1.02098
EURUSD Currency Market Overview
The EURUSD daily chart analysis, based on Elliott Wave Theory, indicates a strong bullish trend in an impulsive mode. The current wave structure highlights the initiation of Orange Wave 3, following the completion of Orange Wave 2 within Navy Blue Wave 1. This development signals a continuation of upward momentum, supporting further price appreciation.
The Navy Blue Wave 1 represents a critical stage in the broader bullish cycle. With Orange Wave 3 now in play, market activity is expected to intensify, leading to stronger price fluctuations. The conclusion of Orange Wave 2 provides a solid support base, reinforcing the uptrend potential.
EURUSD Technical Insights
The emergence of Orange Wave 3 marks a significant bullish phase, indicating a potential upside breakout. The wave cancel invalidation level is set at 1.02098, meaning that a drop below this threshold would invalidate the current wave count and require a market reassessment.
Conclusion
The EURUSD daily chart maintains a bullish outlook, with Orange Wave 3 actively progressing, confirming continued upward movement. The completion of Orange Wave 2 within Navy Blue Wave 1 further strengthens this positive market sentiment.
Traders should closely monitor price action and observe the wave invalidation level to validate the ongoing bullish momentum or adjust their trading strategies accordingly. This Elliott Wave analysis emphasizes the current uptrend dynamics, offering valuable insights into EURUSD market behavior.
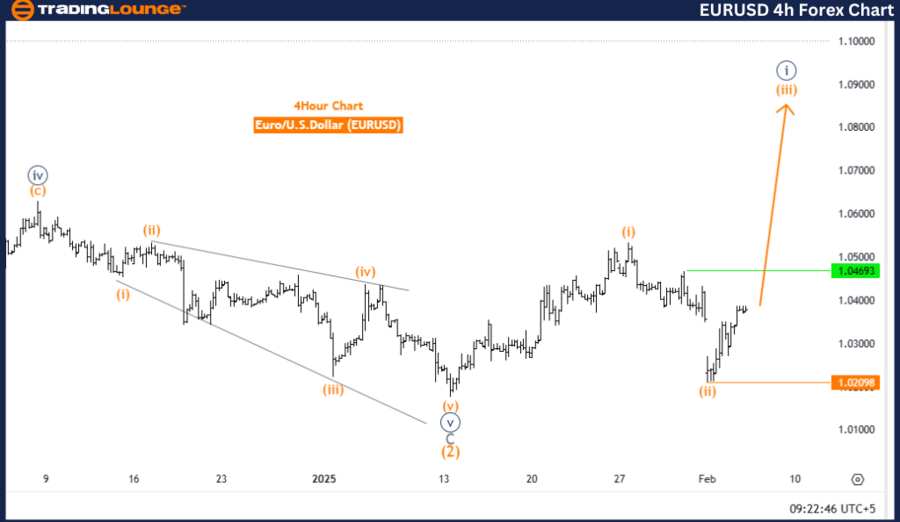
Euro/U.S. Dollar (EURUSD) 4-Hour Chart Analysis
EURUSD Elliott Wave Technical Analysis
Function: Bullish Trend
Mode: Impulsive
Structure: Orange Wave 3
Position: Navy Blue Wave 1
Next Higher Degree Direction: Orange Wave 3 (In Progress)
Details:
EURUSD Forex Market Overview
The EURUSD 4-hour chart analysis, utilizing Elliott Wave Theory, confirms a bullish market trend in an impulsive mode. The current wave structure focuses on the development of Orange Wave 3, which has started after the completion of Orange Wave 2 within Navy Blue Wave 1. This suggests a continued upward trajectory, with further price expansion likely.
The Navy Blue Wave 1 represents the early stage of a larger bullish wave cycle. As Orange Wave 3 progresses, traders should anticipate higher volatility and stronger momentum, typical characteristics of this wave phase. The completion of Orange Wave 2 establishes a firm base, reinforcing the bullish market trend.
EURUSD Forex Technical Insights
The Orange Wave 3 phase is crucial in the ongoing Elliott Wave cycle, signaling further upside potential. The wave cancel invalidation level is set at 1.02098, meaning a drop below this level would invalidate the current wave count, requiring a new market analysis.
Conclusion
The EURUSD 4-hour chart sustains a bullish outlook, with Orange Wave 3 actively progressing, indicating further upside movement. The completion of Orange Wave 2 within Navy Blue Wave 1 strengthens the bullish structure.
Traders should closely observe price fluctuations and remain cautious of the wave invalidation level, ensuring alignment with the prevailing market trend. This Elliott Wave analysis highlights the bullish momentum driving EURUSD, providing valuable insights for strategic trading decisions.
Technical Analyst: Malik Awais
Source: visit Tradinglounge.com and learn From the Experts Join TradingLounge Here
Previous: GBPUSD Elliott Wave Technical Analysis
VALUE Offer - Buy 1 Month & Get 3 Months!Click here
Access 7 Analysts Over 200 Markets Covered. Chat Room With Support
'