06Jan

NVIDIA Corp. (NVDA) Stock Analysis: Elliott Wave Forecast, Bullish Trend Insights, Technical Chart Patterns

This analysis of NVIDIA Corp. (NVDA) incorporates insights from Elliott Wave Theory using both the daily and 1-hour charts. The focus is on critical support at $150 as a pivotal point in the continued upward movement in wave structures, projecting further bullish potential as long as key structural levels hold.

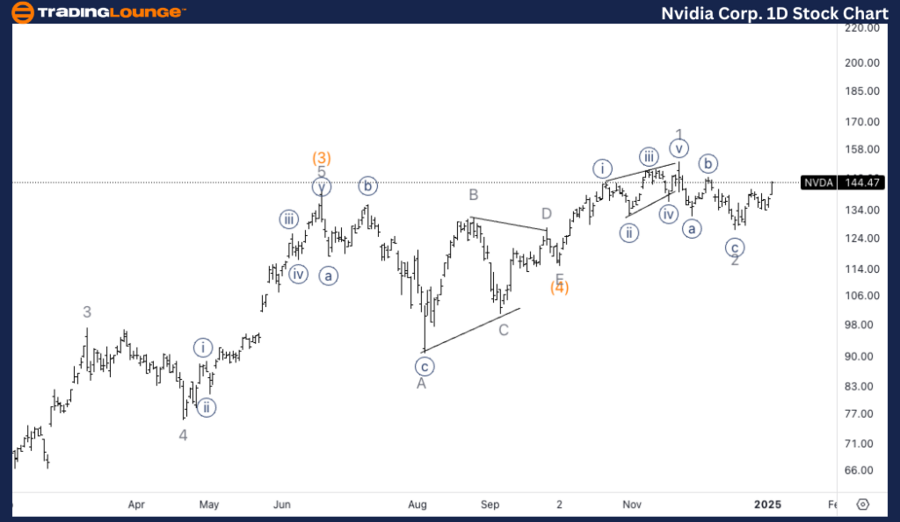
NVIDIA Corp. (NVDA) Elliott Wave Analysis – Trading Lounge Daily Chart

NVDA Elliott Wave Technical Analysis

Function: Trend

Mode: Impulsive

Structure: Motive

Position: Minor wave 3

Direction: Upside in 3 of (5).

Details

The analysis focuses on the continuation of the uptrend into wave (5). Currently, NVIDIA is trading slightly below the Medium Level at $150, with the expectation that support above this level will confirm a bullish outlook.

NVDA Elliott Wave Technical Analysis – Daily Chart

On the daily chart, NVIDIA is advancing through Minor wave 3 of the larger wave (5). The uptrend is expected to persist, with a key focus on the $150 Medium Level as a potential support zone. A sustained hold and bounce above this level would validate the bullish scenario and signal the continuation of the rally. Successfully breaking and maintaining levels above $150 would further confirm the upward trajectory of wave (5).

NVIDIA-Corp-1d-stock...


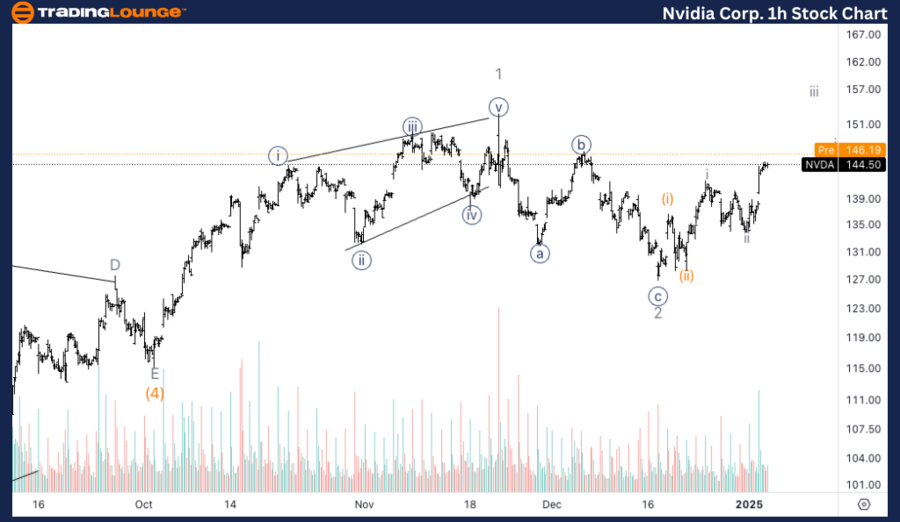
NVIDIA Corp. (NVDA)  Elliott Wave Analysis – Trading Lounge 1H Chart

NVDA Elliott Wave Technical Analysis

Function: Trend

Mode: Impulsive

Structure: Motive

Position: Wave (iii) of {i}

Direction: Upside into wave (iii).

Details

The 1-hour chart highlights the progression of wave (iii) within the broader wave {i} structure. A series of ones and twos within wave {i} is building momentum to challenge the critical $150 level. The next pullback must remain above the territory of wave i to preserve the impulsive structure.

NVDA Elliott Wave Technical Analysis – 1H Chart

The 1-hour chart illustrates the formation of wave (iii) of wave {i}, signaling potential momentum toward a decisive break above the $150 level. Internal subdivisions (ones and twos) are anticipated to drive this movement. Maintaining wave integrity requires the next pullback to avoid retracing into wave i territory. A strong breakout above $150 with sustained momentum would confirm further upside in wave (iii).

Technical Analyst: Alessio Barretta

Source: visit Tradinglounge.com and learn From the Experts Join TradingLounge Here 

See Previous: Advanced Micro Devices Inc. (AMD) Elliott Wave Technical Analysis

VALUE Offer - Buy 1 Month & Get 3 Months!Click here

Access 7 Analysts Over 200 Markets Covered. Chat Room With Support

NVIDIA-Corp-1h-stock...

Related

Elliott Wave Technical Analysis and Stock Forecast for Dr Reddy's Laboratories: Key Insights and Price Targets

Elliott Wave Technical Analysis and Stock Forecast for Dr Reddy's Laboratories: Key Insights and Price Targets

Discover comprehensive Elliott Wave analysis and technical insights for Dr Reddy's Laboratories....

Read More >
Stay Informed on Commodity Market: GX Uranium ETF (URA) Elliott Wave Technical Analysis

Stay Informed on Commodity Market: GX Uranium ETF (URA) Elliott Wave Technical Analysis

The Global X Uranium ETF (GX URA) offers investors a diversified portfolio of companies engaged in u...

Read More >
Larsen & Toubro Elliott Wave Analysis Reveals Bullish Impulse Wave Formation on Daily and Weekly Charts with Key Trading Levels

Larsen & Toubro Elliott Wave Analysis Reveals Bullish Impulse Wave Formation on Daily and Weekly Charts with Key Trading Levels

Larsen & Toubro is forming a bullish Elliott Wave pattern, with impulse waves in development on dail...

Read More >
Bitcoin (BTCUSD) Elliott Wave 3 Forecast: Swing Trade Setup & Price Targets with Key Support, Breakout Alert & Invalidation Level

Bitcoin (BTCUSD) Elliott Wave 3 Forecast: Swing Trade Setup & Price Targets with Key Support, Breakout Alert & Invalidation Level

Elliott Wave breakdown for BTCUSD targeting wave 3 upside. Includes correction zones at $107.2K–$10...

Read More >
Unlocking Market Potential: SP500 at 5000 and Nasdaq 100 at 18000 Resistances - Elliott Wave Analysis Update

Unlocking Market Potential: SP500 at 5000 and Nasdaq 100 at 18000 Resistances - Elliott Wave Analysis Update

SP500 at 5000, Nasdaq 100 near 18000 resistance. Markets may temporarily breach, but gravitational p...

Read More >

$1 for 2 Weeks

then $29 a month!

What a Special Offer!

Trade Recommendations

Unleash the power of deversified trading with our comprehensive portfolio, covering 250+ markets:

  • Stock Trades
  • Crypto Trades
  • Forex Trades
  • Commodity Trades
Elliott Wave Analysis

Gain a competitive edge with expert insights and AI-powered Elliott Wave charting into:

  • Global Indices
  • US Stocks & ASX Stocks
  • Forex & Crypto
  • Commodities
Top-Notch Trading Tools

Equip yourself with the tools of success:

  • Real-time Chat rooms
  • Elliott Wave Algorithm
  • Portfolio tools
  • TradingLevels
  • Screener
  • Trading Game
7 Elliott Wave Analysts

Stay ahead of the market with daily charts and insightful videos
Your secret to strategic trading!

JOIN HERE


Welcome to TradingLounge (ASIC A.R.No. 321187), specialists in trades, trading education and technical analysis, covering stocks, indices, commodities, forex and cryptocurrencies.

When you join TradingLounge you have access to everything we offer, including trade tools, educational content and a social platform to chat with like-minded investors.

Read more

@Copyright 2024 by tradinglounge.com

Contact Us

Australian no: 02 4787 6020

International no: +61 (2) 47876020

Pay with:

Find us on