Elliott Wave Analysis of Analog Devices Inc. (ADI): Current Trends and Potential Movements

This detailed Elliott Wave analysis of Analog Devices Inc. (ADI) examines the daily and 1-hour chart structures, shedding light on the prevailing trends and potential future price movements.

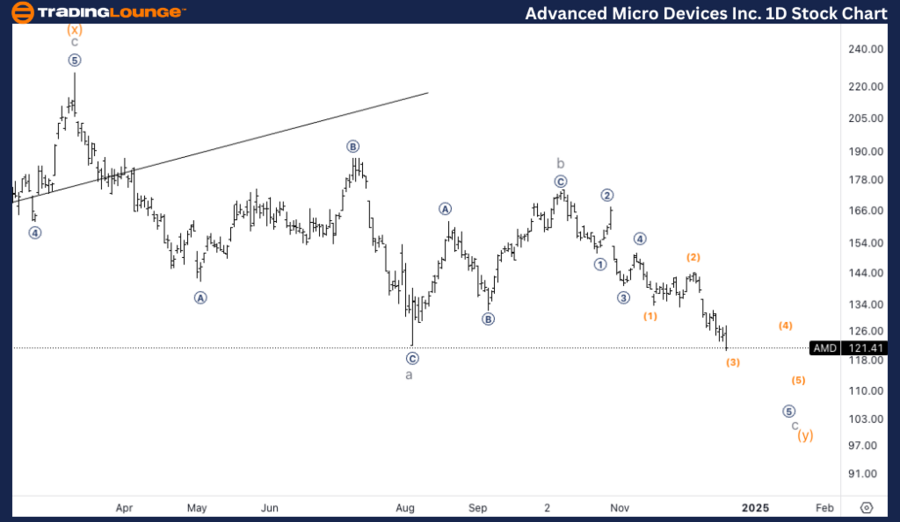
AMD Elliott Wave Analysis: Trading Lounge Daily Chart

Advanced Micro Devices Inc. (AMD) Daily Chart Analysis

AMD Elliott Wave Technical Analysis Overview:

  • Function: Counter Trend
  • Mode: Corrective
  • Structure: Complex
  • Position: Wave c of (y) of {iv}
  • Direction: Downside into wave c

Key Insights:

  • After encountering resistance at TradingLevel2 ($200), AMD's price has retraced to $120, a level where support might form.
  • The stock is in wave c of a complex correction (y) within wave {iv}.
  • A further decline is expected before completing this corrective phase, as wave c of (y) could push lower before reversing.

AMD Daily Chart Analysis – Summary

The daily Elliott Wave analysis suggests AMD is undergoing a corrective phase in wave {iv}. This phase involves wave c of (y), indicating further downside potential before a rebound occurs. The critical resistance at $200 caused a retracement to $120, where temporary support may emerge. However, additional downside pressure is likely before this phase concludes.

Advanced-Micro-Devic...


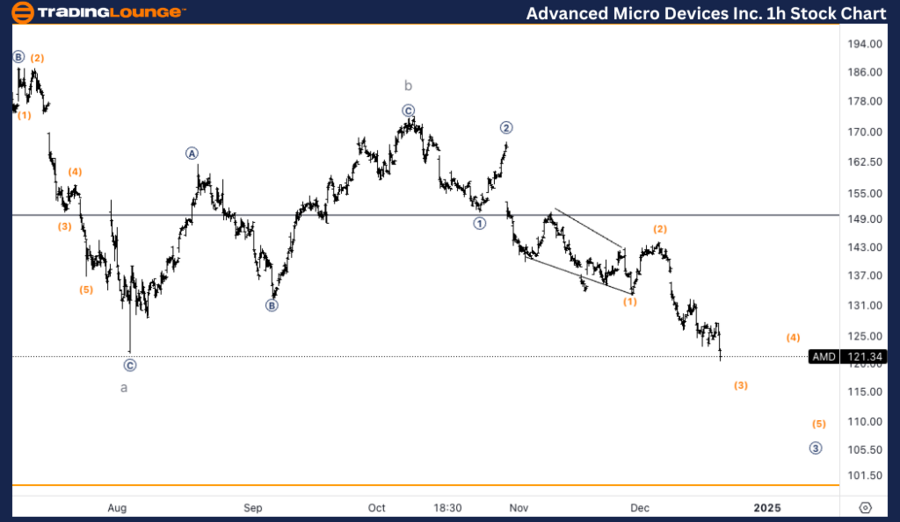
AMD Elliott Wave Analysis: Trading Lounge 1-Hour Chart

Advanced Micro Devices Inc. (AMD) 1H Chart Analysis

Technical Analysis Overview:

  • Function: Counter Trend
  • Mode: Corrective
  • Structure: Complex
  • Position: Wave (3) of micro 3
  • Direction: Downside in wave 3

Key Insights:

  • The 1-hour chart indicates AMD is within wave (3) of micro wave 3, part of a larger wave c correction.
  • An internal subdivision is evident, with further downside likely in supermicro wave (3) of micro 3.
  • The current structure suggests continued downward momentum in the short term.

AMD 1H Chart Analysis – Summary

The 1-hour Elliott Wave chart analysis highlights AMD's ongoing wave (3) of micro wave 3, part of the broader wave c correction. This pattern points to additional downside pressure as the correction unfolds, with short-term support levels unlikely to halt the downward movement entirely. Further declines are anticipated before the correction completes.

Technical Analyst: Alessio Barretta

Source: visit Tradinglounge.com and learn From the Experts Join TradingLounge Here 

See Previous: MicroStrategy Inc. (MSTR) Elliott Wave Technical Analysis

VALUE Offer - Buy 1 Month & Get 3 Months!Click here

Access 7 Analysts Over 200 Markets Covered. Chat Room With Support

Advanced-Micro-Devic...

Related

AUDUSD Technical Analysis: Elliott Wave Insights, Daily & 4-Hour Chart Trends, Forecasts, and Trading Strategies for 2025

AUDUSD Technical Analysis: Elliott Wave Insights, Daily & 4-Hour Chart Trends, Forecasts, and Trading Strategies for 2025

Based on Elliott Wave analysis, the Australian Dollar to US Dollar (AUDUSD) pair is undergoing a sig...

Read More >
Learn About the ASX WBC Share Price Forecasts, and Technical Chart Updates For Westpac Banking Corporation Elliott Wave Analysis

Learn About the ASX WBC Share Price Forecasts, and Technical Chart Updates For Westpac Banking Corporation Elliott Wave Analysis

Our detailed Elliott Wave analysis will give valuable insights into ASX: Westpac Banking Corporation...

Read More >
Caterpillar Inc. Elliott Wave Technical Analysis: Corrective Wave Trends, Technical Patterns, and Price Target Insights for Traders

Caterpillar Inc. Elliott Wave Technical Analysis: Corrective Wave Trends, Technical Patterns, and Price Target Insights for Traders

Caterpillar Inc. (CAT), highlighting potential bottom formations in wave {iv} and future price targe...

Read More >
Elliott Wave Analysis Highlights: Navigating Commodity Market Trends with Confidence

Elliott Wave Analysis Highlights: Navigating Commodity Market Trends with Confidence

This summary highlights the key points from an Elliott Wave analysis update on commodity markets. Th...

Read More >
EURUSD Elliott Wave Technical Analysis Reveals Bullish Trends and Forecasts Potential Corrective Phases for Informed Forex Trading

EURUSD Elliott Wave Technical Analysis Reveals Bullish Trends and Forecasts Potential Corrective Phases for Informed Forex Trading

Our latest EURUSD Elliott Wave Analysis reveals a bullish trend, indicating the completion of orange...

Read More >

$1 for 2 Weeks

then $29 a month!

What a Special Offer!

Trade Recommendations

Unleash the power of deversified trading with our comprehensive portfolio, covering 250+ markets:

  • Stock Trades
  • Crypto Trades
  • Forex Trades
  • Commodity Trades
Elliott Wave Analysis

Gain a competitive edge with expert insights and AI-powered Elliott Wave charting into:

  • Global Indices
  • US Stocks & ASX Stocks
  • Forex & Crypto
  • Commodities
Top-Notch Trading Tools

Equip yourself with the tools of success:

  • Real-time Chat rooms
  • Elliott Wave Algorithm
  • Portfolio tools
  • TradingLevels
  • Screener
  • Trading Game
7 Elliott Wave Analysts

Stay ahead of the market with daily charts and insightful videos
Your secret to strategic trading!

JOIN HERE


Welcome to TradingLounge (ASIC A.R.No. 321187), specialists in trades, trading education and technical analysis, covering stocks, indices, commodities, forex and cryptocurrencies.

When you join TradingLounge you have access to everything we offer, including trade tools, educational content and a social platform to chat with like-minded investors.

Read more

@Copyright 2024 by tradinglounge.com

Contact Us

Australian no: 02 4787 6020

International no: +61 (2) 47876020

Pay with:

Find us on