13Jan

AUDUSD Technical Analysis: Elliott Wave Insights, Daily & 4-Hour Chart Trends, Forecasts, and Trading Strategies for 2025

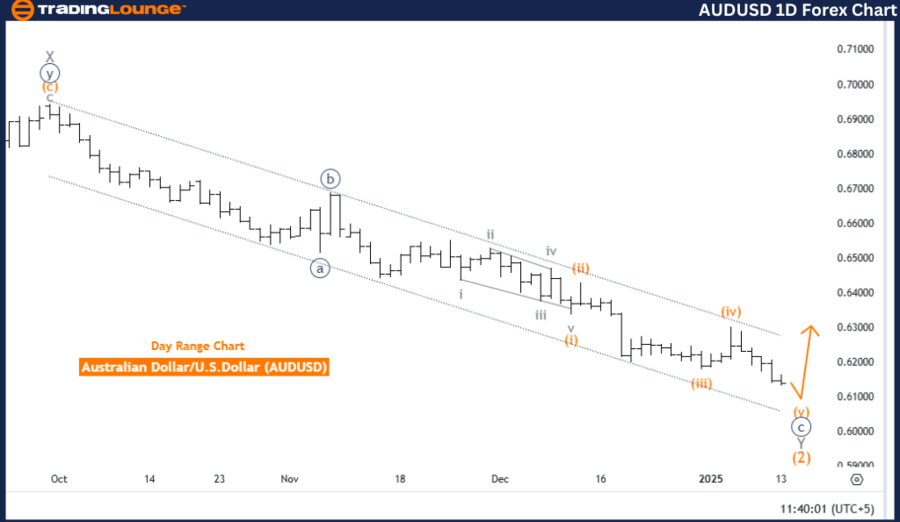
Australian Dollar/U.S. Dollar (AUDUSD) Daily Chart

AUDUSD Elliott Wave Technical Analysis

Function: Counter-trend

Mode: Impulsive as Wave C

Structure: Navy blue Wave C

Position: Gray Wave Y of 2

Next Higher Degree Direction: Orange Wave 1 (New Trend)

Details:

The Australian Dollar to US Dollar (AUDUSD) is in a counter-trend phase based on Elliott Wave Analysis of the daily chart. The market is progressing within an impulsive wave labeled navy blue Wave C, part of the broader gray Wave Y of 2 corrective structure. This phase is nearing completion, indicating a potential market transition.

  • Navy blue Wave C represents the final impulsive wave within the current corrective phase, signaling the completion of gray Wave Y of 2.
  • The completion of navy blue Wave C sets the stage for the next major market movement, orange Wave 1, which marks the beginning of a new bullish trend.
  • As navy blue Wave C approaches its conclusion, traders should anticipate a shift from the counter-trend phase to an impulsive trend that aligns with broader market dynamics.

Summary:

The AUDUSD pair is nearing the end of its corrective phase as navy blue Wave C unfolds within the gray Wave Y of 2 structure. This pivotal phase signals the culmination of the counter-trend movement and prepares the market for a new bullish trend, starting with orange Wave 1. The end of navy blue Wave C represents a key turning point, offering insights into the potential for upward market momentum.

AUDUSD-1d-forex-char...


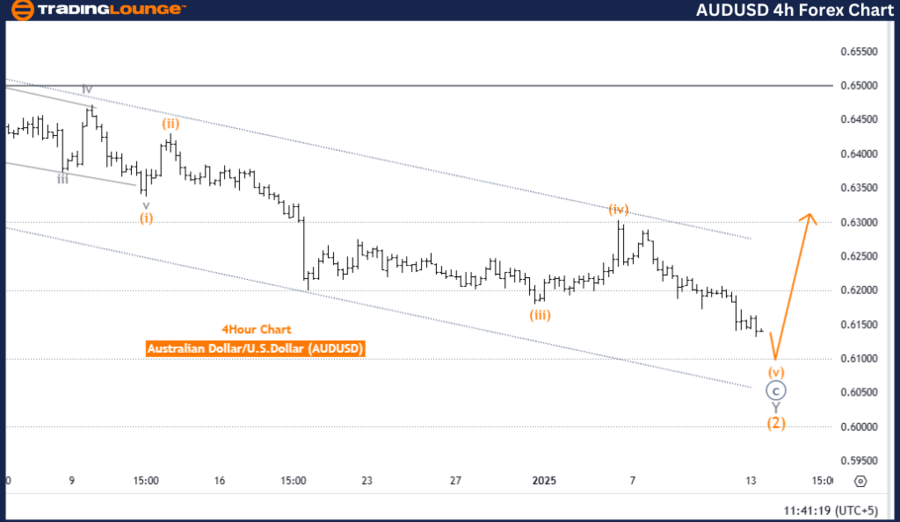
Australian Dollar/U.S. Dollar (AUDUSD) 4-Hour Chart

AUDUSD Elliott Wave Technical Analysis

Function: Counter-trend

Mode: Impulsive

Structure: Orange Wave 5

Position: Navy Blue Wave C

Next Higher Degree Direction: Orange Wave 1 (New Trend)

Details:

The AUDUSD currency pair remains in a counter-trend phase as identified by Elliott Wave Analysis of the 4-hour chart. The market is progressing through orange Wave 5, a component of the larger navy blue Wave C structure. Following the completion of orange Wave 4, the market has shifted focus to the development of orange Wave 5.

  • Orange Wave 5 serves as the final impulsive wave within the navy blue Wave C corrective phase.
  • Upon completion, orange Wave 5 will conclude the corrective sequence and pave the way for the start of a new bullish trend, orange Wave 1, at a higher degree.
  • This transition will mark the end of the corrective phase, shifting the market toward an upward trajectory.

Summary:

The AUDUSD pair is nearing the conclusion of its corrective phase with orange Wave 5 unfolding as part of navy blue Wave C. The end of this sequence signifies a crucial transition, preparing the market for the anticipated upward trend initiated by orange Wave 1. The progression through orange Wave 5 will confirm the conclusion of the corrective structure and establish the foundation for bullish market momentum.

Technical Analyst: Malik Awais

Source: visit Tradinglounge.com and learn From the Experts Join TradingLounge Here 

Previous: USDJPY Elliott Wave Technical Analysis

VALUE Offer - Buy 1 Month & Get 3 Months!Click here

Access 7 Analysts Over 200 Markets Covered. Chat Room With Support

AUDUSD-4h-forex-char...

Related

Advanced Forex Trading Strategies: U.S.Dollar /Canadian Dollar (USD/CAD) Forex Elliott Wave Technical Analysis

Advanced Forex Trading Strategies: U.S.Dollar /Canadian Dollar (USD/CAD) Forex Elliott Wave Technical Analysis

This detailed USD/CAD Elliott Wave analysis provides traders with essential insights into the curren...

Read More >
GX Uranium ETF Commodity Elliott Wave Technical Analysis Reveals that Uranium Market is in a Bullish Phase

GX Uranium ETF Commodity Elliott Wave Technical Analysis Reveals that Uranium Market is in a Bullish Phase

The Global X Uranium ETF (GX URA) offers a diversified portfolio of companies involved in uranium mi...

Read More >
S&P/TSX 60 Elliott Wave Technical  Analysis: Market Trends, Corrective Wave Structure, Stock Forecast, Trading Strategy

S&P/TSX 60 Elliott Wave Technical Analysis: Market Trends, Corrective Wave Structure, Stock Forecast, Trading Strategy

Elliott Wave Analysis of the S&P/TSX 60 index, covering key aspects such as counter-trend movements,...

Read More >
Bullish QUALCOMM Inc Elliott Wave Forecast: Daily Wave {iii} Strength at $150, 1‑Hour Wave (iv) Correction Sets Up Wave (v) Breakout

Bullish QUALCOMM Inc Elliott Wave Forecast: Daily Wave {iii} Strength at $150, 1‑Hour Wave (iv) Correction Sets Up Wave (v) Breakout

Bullish Elliott Wave analysis for QCOM shows wave {iii} progressing on the daily chart, with support...

Read More >
Binance Crypto Price News Today Elliott Wave Technical Analysis: Mastering BNBUSD Trading Dynamics

Binance Crypto Price News Today Elliott Wave Technical Analysis: Mastering BNBUSD Trading Dynamics

This article provides a comprehensive Elliott Wave analysis of the Binance/US Dollar (BNBUSD) tradin...

Read More >
Australian Dollar/U.S. Dollar (AUDUSD) Elliott Wave Analysis for Daily and 4-Hour Charts Featuring Forecast, and Key Technical Levels

Australian Dollar/U.S. Dollar (AUDUSD) Elliott Wave Analysis for Daily and 4-Hour Charts Featuring Forecast, and Key Technical Levels

AUDUSD Elliott Wave technical analysis provides a detailed breakdown of the current wave structure o...

Read More >

$1 for 2 Weeks

then $29 a month!

What a Special Offer!

Trade Recommendations

Unleash the power of deversified trading with our comprehensive portfolio, covering 250+ markets:

  • Stock Trades
  • Crypto Trades
  • Forex Trades
  • Commodity Trades
Elliott Wave Analysis

Gain a competitive edge with expert insights and AI-powered Elliott Wave charting into:

  • Global Indices
  • US Stocks & ASX Stocks
  • Forex & Crypto
  • Commodities
Top-Notch Trading Tools

Equip yourself with the tools of success:

  • Real-time Chat rooms
  • Elliott Wave Algorithm
  • Portfolio tools
  • TradingLevels
  • Screener
  • Trading Game
7 Elliott Wave Analysts

Stay ahead of the market with daily charts and insightful videos
Your secret to strategic trading!

JOIN HERE


Welcome to TradingLounge (ASIC A.R.No. 321187), specialists in trades, trading education and technical analysis, covering stocks, indices, commodities, forex and cryptocurrencies.

When you join TradingLounge you have access to everything we offer, including trade tools, educational content and a social platform to chat with like-minded investors.

Read more

@Copyright 2024 by tradinglounge.com

Contact Us

Australian no: 02 4787 6020

International no: +61 (2) 47876020

Pay with:

Find us on