21Feb

Bitcoin Price Prediction & Elliott Wave BTCUSD Analysis: BTC Technical Forecast, Key Support & Resistance Levels, Market Trends

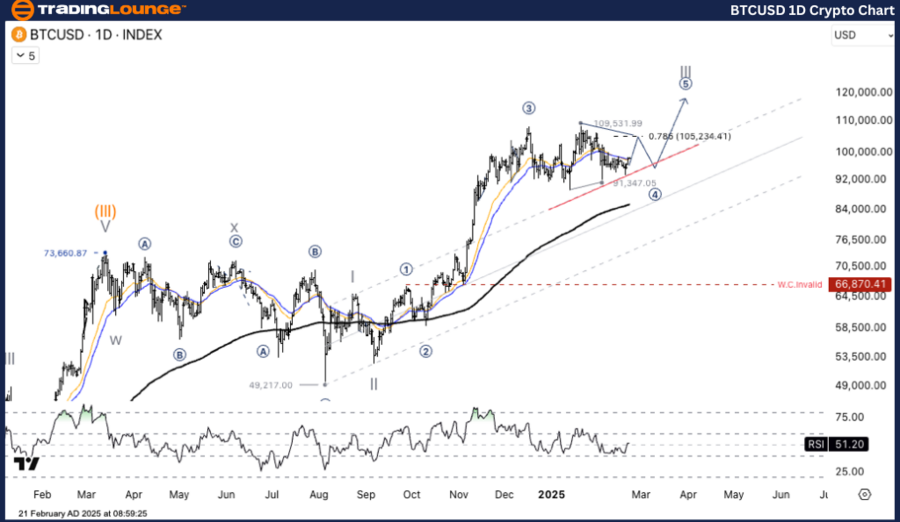
BTCUSD Elliott Wave Technical Analysis – TradingLounge Daily Chart

BTCUSD Elliott Wave Technical Analysis

Function: Counter Trend

Mode: Corrective

Structure: Triangle

Position: Wave (D)

Next Higher Degree Direction: Wave ((4))

Invalidation Level: -

Details: Bitcoin (BTCUSD) is in the final phase of a Triangle Correction (A-B-C-D-E), which is part of a Wave 4 correction pattern. The current price movement suggests an upward push in Wave D, before a potential retracement to Wave E ahead of a larger bullish breakout in Wave 5, leading into Wave III.

Bitcoin (BTCUSD) Trading Strategy – Daily Chart

BTCUSD is currently advancing in Wave D, testing a crucial resistance level at 105,234 USD (Fib 0.786). Following this, a possible retracement into Wave E could precede a bullish Wave 5 breakout, potentially extending into Wave III.

Trading Strategies – Daily Chart

 Long Strategy:

  • Consider entering a long position at 96,500 USD if a reversal signal confirms an upward movement.

 Risk Management:

  • Invalidation Level: Exit the position if BTCUSD drops below 91,347 USD.

BTCUSD-1d-crypto-cha...


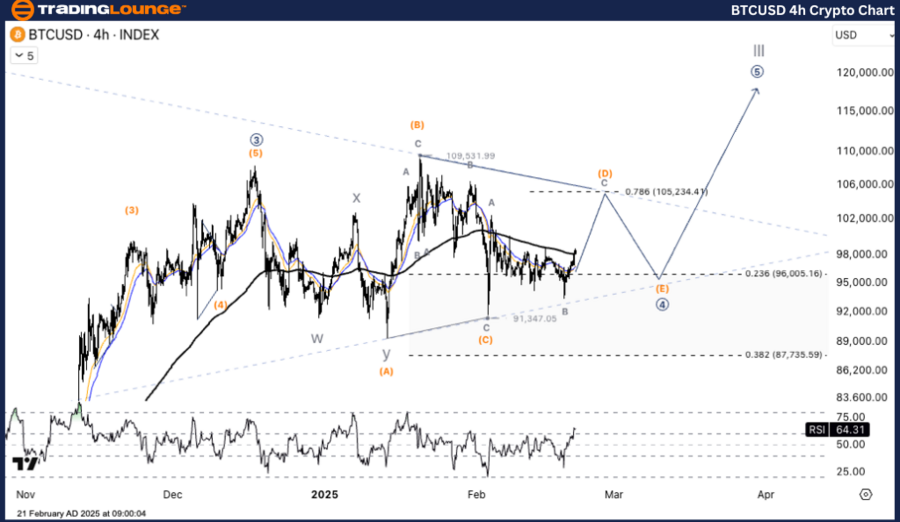
BTCUSD Elliott Wave Technical Analysis – TradingLounge H4 Chart

Function: Counter Trend

Mode: Corrective

Structure: Triangle

Position: Wave (D)

Next Higher Degree Direction: Wave ((4))

Invalidation Level: -

Details: Bitcoin’s price movement aligns with the final stages of a Triangle Correction (A-B-C-D-E), indicating a near-term completion of Wave D before a retracement into Wave E, eventually leading to a strong bullish Wave 5 impulse in Wave III.

Bitcoin (BTCUSD) Trading Strategy – H4 Chart

BTCUSD remains within Wave D, approaching the critical 105,234 USD resistance zone (Fib 0.786). A short-term retracement into Wave E is possible before Bitcoin resumes its Wave 5 rally, continuing the larger Elliott Wave cycle.

Trading Strategies – H4 Chart

 Long Strategy:

  • Consider entering a long position at 96,500 USD if a confirmed reversal pattern emerges.

 Risk Management:

  • Invalidation Level: Close positions if BTCUSD falls below 91,347 USD.

Technical Analyst: Kittiampon Somboonsod

Source: visit Tradinglounge.com and learn From the Experts Join TradingLounge Here 

Previous: THETAUSDT Elliott Wave Technical Analysis

VALUE Offer - Buy 1 Month & Get 3 Months!Click here

Access 7 Analysts Over 200 Markets Covered. Chat Room With Support

BTCUSD-4h-crypto-cha...

Related

S&P/TSX 60 Index Elliott Wave Technical Analysis Shows Reinforcing the overall Bullish Outlook in both Daily and Weekly Charts

S&P/TSX 60 Index Elliott Wave Technical Analysis Shows Reinforcing the overall Bullish Outlook in both Daily and Weekly Charts

The S&P/TSX 60 is in a bullish trend, according to Elliott Wave analysis. Gray wave 2 of orange wave...

Read More >
U.S.Dollar/Japanese Yen(USDJPY) Forex - Elliottwave Technical analysis

U.S.Dollar/Japanese Yen(USDJPY) Forex - Elliottwave Technical analysis

Elliott Wave analysis of the USDJPY currency pair, providing traders with a detailed forecast and in...

Read More >
in-depth Analysis and Trading Strategies S&P/ASX 200 Indices Elliott Wave Technical Analysis

in-depth Analysis and Trading Strategies S&P/ASX 200 Indices Elliott Wave Technical Analysis

Stay ahead in the S&P/ASX 200 market with our in-depth analysis and trading strategies. Our comprehe...

Read More >
NORTHERN STAR RESOURCES LTD – NST Elliott Wave Forecast Signals Bearish Trend, Targeting 16.86 with Full Technical Chart Insight

NORTHERN STAR RESOURCES LTD – NST Elliott Wave Forecast Signals Bearish Trend, Targeting 16.86 with Full Technical Chart Insight

ASX:NST is trending downward per Elliott Wave analysis, targeting 16.86. No bullish reversal signs a...

Read More >
U.S. Dollar/Canadian Dollar (USDCAD) Forex Elliott Wave Technical Analysis: Daily and 4-Hour Chart Insights

U.S. Dollar/Canadian Dollar (USDCAD) Forex Elliott Wave Technical Analysis: Daily and 4-Hour Chart Insights

Explore the in-depth USD/CAD Elliott Wave Analysis covering daily and 4-hour chart insights. Our ana...

Read More >

$1 for 2 Weeks

then $29 a month!

What a Special Offer!

Trade Recommendations

Unleash the power of deversified trading with our comprehensive portfolio, covering 250+ markets:

  • Stock Trades
  • Crypto Trades
  • Forex Trades
  • Commodity Trades
Elliott Wave Analysis

Gain a competitive edge with expert insights and AI-powered Elliott Wave charting into:

  • Global Indices
  • US Stocks & ASX Stocks
  • Forex & Crypto
  • Commodities
Top-Notch Trading Tools

Equip yourself with the tools of success:

  • Real-time Chat rooms
  • Elliott Wave Algorithm
  • Portfolio tools
  • TradingLevels
  • Screener
  • Trading Game
7 Elliott Wave Analysts

Stay ahead of the market with daily charts and insightful videos
Your secret to strategic trading!

JOIN HERE


Welcome to TradingLounge (ASIC A.R.No. 321187), specialists in trades, trading education and technical analysis, covering stocks, indices, commodities, forex and cryptocurrencies.

When you join TradingLounge you have access to everything we offer, including trade tools, educational content and a social platform to chat with like-minded investors.

Read more

@Copyright 2024 by tradinglounge.com

Contact Us

Australian no: 02 4787 6020

International no: +61 (2) 47876020

Pay with:

Find us on