S&P/TSX 60 Elliott Wave Analysis Trading Lounge Day Chart
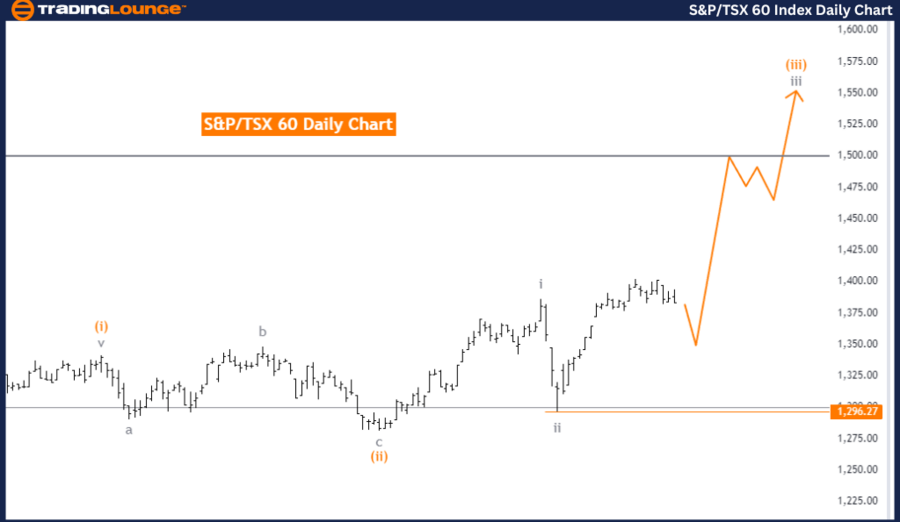
S&P/TSX 60 Daily Chart Analysis
S&P/TSX 60 Elliott Wave Technical Analysis
FUNCTION: Bullish Trend
MODE: Impulsive
STRUCTURE: Gray Wave 3
POSITION: Orange Wave 3
DIRECTION NEXT HIGHER DEGREES: Gray Wave 3 (Continue)
DETAILS: Gray wave 2 of orange wave 3 has seemingly completed. The market is now progressing into gray wave 3 of 3. The invalidation level for wave cancellation is set at 1,296.27.
The S&P/TSX 60 daily chart indicates a strong bullish trend based on Elliott Wave analysis. This trend is currently in an impulsive mode, showcasing strong upward momentum. The market structure being analyzed is gray wave 3, with the present market position classified under orange wave 3.
With gray wave 2 of orange wave 3 now completed, the market is advancing into gray wave 3 of orange wave 3. This suggests that the bullish trend is continuing with anticipated further gains. The ongoing movement in gray wave 3 signals that the market’s bullish momentum is expected to persist in the short term.
A crucial element in this analysis is the invalidation level, set at 1,296.27. If the market price drops below this level, the current Elliott Wave count would be deemed invalid, and traders would need to reassess the market direction with a new analysis.
Summary:
The S&P/TSX 60 daily chart shows a bullish, impulsive trend, with both gray wave 3 and orange wave 3 playing out. With gray wave 2 completed, the market is now moving into gray wave 3 of 3. The invalidation level at 1,296.27 is key to monitor; a drop below this level would invalidate the current wave analysis, necessitating a fresh evaluation of the market’s direction.
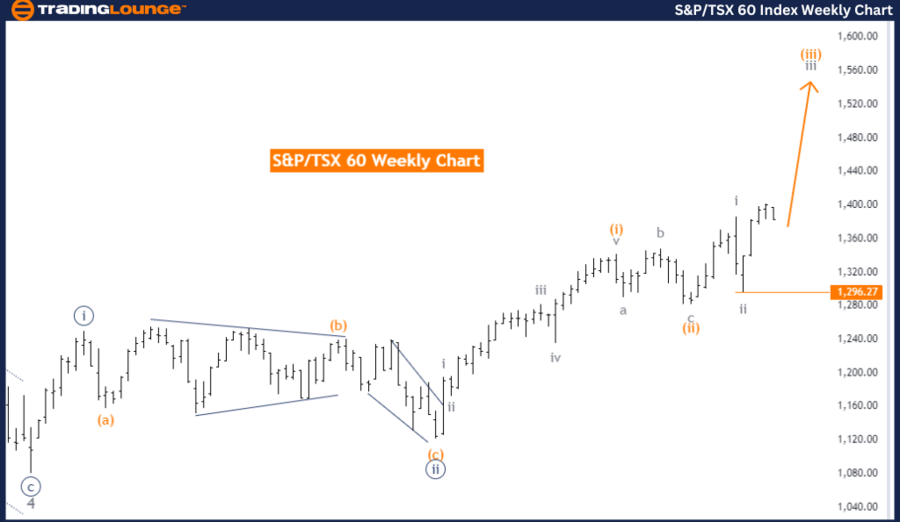
S&P/TSX 60 Elliott Wave Analysis Trading Lounge Weekly Chart
S&P/TSX 60 MarketTechnical Analysis
FUNCTION: Bullish Trend
MODE: Impulsive
STRUCTURE: Gray Wave 3
POSITION: Orange Wave 3
DIRECTION NEXT HIGHER DEGREES: Gray Wave 3 (Continue)
DETAILS: Gray wave 2 of orange wave 3 appears completed, and the market has now entered gray wave 3 of 3. The wave cancellation invalidation level is set at 1,296.27.
The S&P/TSX 60 weekly chart continues to reflect a bullish trend based on Elliott Wave technical analysis. The market remains in an impulsive mode, indicating sustained upward momentum. The current wave structure under observation is gray wave 3, with the position identified as orange wave 3. This suggests that the market is still moving through a series of upward trends as part of the larger bullish movement.
The analysis confirms that gray wave 2 of orange wave 3 has concluded, and gray wave 3 of 3 is now in progress. This suggests that the bullish momentum is expected to continue, with further gains likely as the market progresses through the next stages of the wave cycle. The higher-level analysis implies that gray wave 3 should continue advancing, reinforcing the bullish outlook for the medium term.
The invalidation level for this wave count is also set at 1,296.27. Traders should closely monitor this key level, as any drop below it would invalidate the current wave analysis, leading to a potential shift in market direction or requiring a new wave structure evaluation.
Summary:
The S&P/TSX 60 weekly chart presents a bullish, impulsive trend. With gray wave 2 completed and gray wave 3 of orange wave 3 unfolding, further market gains are anticipated. The critical wave cancellation invalidation level remains at 1,296.27. If the market falls below this level, the current wave count would be invalidated, prompting a fresh assessment of the market's trend.
Technical Analyst: Malik Awais
Source: visit Tradinglounge.com and learn From the Experts Join TradingLounge Here
Previous: DAX 40 Index Elliott Wave Technical Analysis
Special Trial Offer - 0.76 Cents a Day for 3 Months! Click here
Access 7 Analysts Over 200 Markets Covered. Chat Room With Support