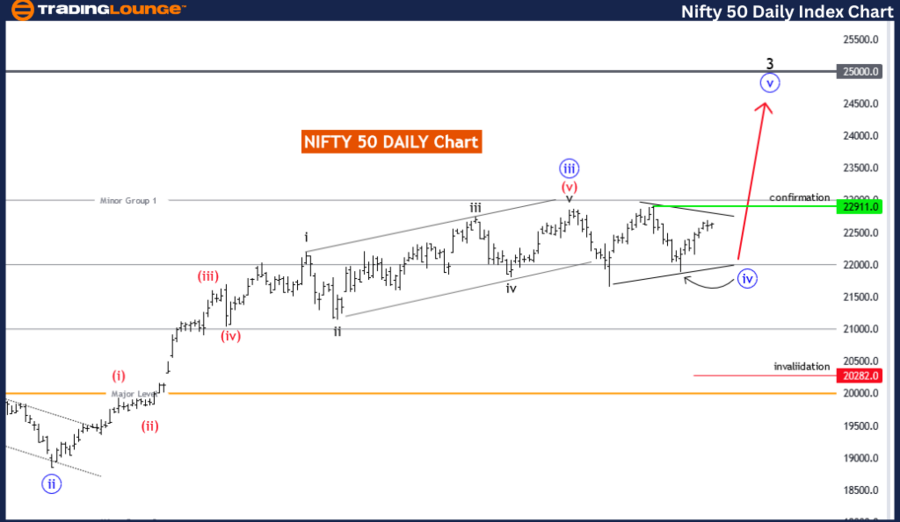
NIFTY 50 (INDIA) Elliott Wave Analysis Trading Lounge Day Chart
NIFTY 50 (INDIA) Elliott Wave Technical Analysis
Function: Trend
Mode: Corrective
Structure: Blue Wave 4
Position: Black Wave 3
Direction Next Higher Degrees: Blue Wave 5
Details: Blue Wave 3 appears completed. Blue Wave 4 of 3 is either in play or completed.
Wave Cancel Invalid Level: 20282.0
The NIFTY 50 (India) Elliott Wave analysis on the daily chart offers a comprehensive overview of market movements within the Elliott Wave sequence. This analysis identifies the primary function as a trend, signifying a long-term market direction. The wave mode is classified as corrective, indicating a retracement or consolidation within the broader trend.
The main structure highlighted is Blue Wave 4, a critical phase in the Elliott Wave cycle that usually follows impulsive movements of previous waves. The current position within this structure is Black Wave 3, indicating active or nearly completed phase progression.
Looking ahead, the next higher degrees direction points towards Blue Wave 5. This projection is significant as it suggests a new impulsive phase after the corrective Blue Wave 4. Blue Wave 5 typically involves strong price actions, potentially leading to new market highs or lows.
Key details in this analysis show Blue Wave 3 appears completed, setting the stage for Blue Wave 4 of Black Wave 3 to either be in play or completed. This phase often involves retracement of previous gains, reflecting the market's cyclical nature.
A crucial aspect of this analysis is the wave cancel invalid level set at a specific price point. If the market price surpasses this level, it invalidates the current wave count, requiring reassessment of the wave structure. This invalidation level serves as a critical checkpoint to confirm the accuracy of the Elliott Wave pattern and expected market behavior.
In summary, the NIFTY 50 index is currently in a corrective phase within Blue Wave 4 on the daily chart, following the completion of Blue Wave 3. The market is either in the process of completing Blue Wave 4 or has already done so, setting the stage for the next impulsive phase, Blue Wave 5. Monitoring the invalidation level is crucial for validating the current wave structure and future market projections.
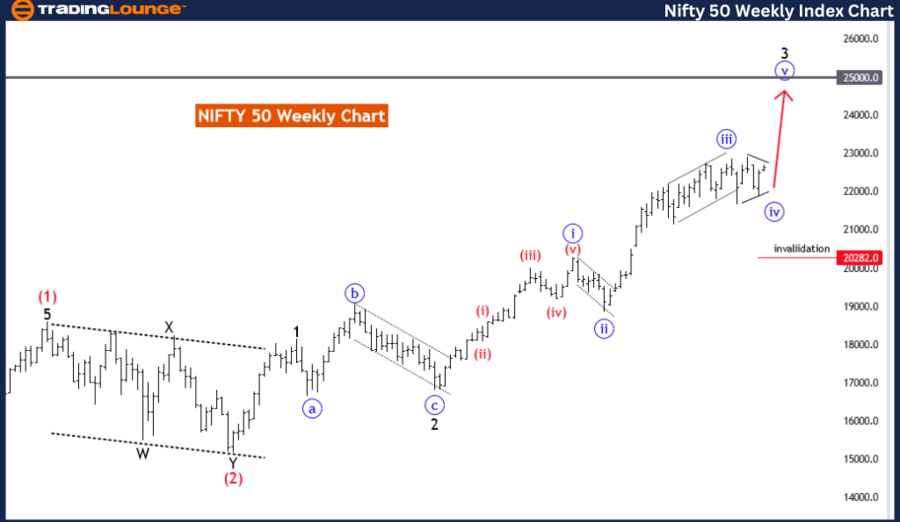
NIFTY 50 (INDIA) Elliott Wave Analysis Trading Lounge Weekly Chart
NIFTY 50 (INDIA) Elliott Wave Technical Analysis
Function: Trend
Mode: Corrective
Structure: Blue Wave 4
Position: Black Wave 3
Direction Next Higher Degrees: Blue Wave 5
Details: Blue Wave 3 appears completed. Blue Wave 4 of 3 is either in play or completed.
Wave Cancel Invalid Level: 20282.0
The NIFTY 50 (India) Elliott Wave analysis on the weekly chart provides an in-depth look at the market's current phase within the Elliott Wave sequence. This analysis identifies the primary function as a trend, indicating a broader, long-term market direction. The wave mode is classified as corrective, suggesting the market is experiencing a retracement or consolidation within this larger trend.
The main structure highlighted is Blue Wave 4, a crucial phase in the Elliott Wave cycle. This phase typically involves corrective patterns following the impulsive movements of preceding waves. The current position within this structure is Black Wave 3, indicating this phase is actively unfolding or nearing completion.
Looking forward, the next higher degrees direction points towards Blue Wave 5. This projection is significant as it anticipates a new impulsive phase following the corrective actions of Blue Wave 4. Blue Wave 5 usually involves robust and decisive price movements, potentially leading to new market highs or lows.
Key details of the analysis reveal that Blue Wave 3 appears completed. This sets the stage for Blue Wave 4 of Black Wave 3 to either be in progress or already completed. This phase typically involves some retracement of previous gains, reflecting the market's natural cyclical nature.
An essential aspect of this analysis is the wave cancel invalid level set at a specific price point. If the market price moves beyond this level, it would invalidate the current wave count, necessitating a reassessment of the wave structure. This invalidation level acts as a critical checkpoint for confirming the accuracy of the Elliott Wave pattern and expected market behavior.
In summary, the NIFTY 50 index is currently in a corrective phase within Blue Wave 4 on the weekly chart, following the completion of Blue Wave 3. The market is either in the process of completing Blue Wave 4 or has already done so, preparing for the next impulsive phase, Blue Wave 5. Monitoring the invalidation level is crucial for validating the current wave structure and future market projections.
Technical Analyst: Malik Awais
Source: visit Tradinglounge.com and learn From the Experts Join TradingLounge Here
See previous: Hang Seng Index Elliott Wave Analysis
Special Trial Offer - 0.76 Cents a Day for 3 Months! Click here
Access 7 Analysts Over 170 Markets Covered. Chat Room With Support