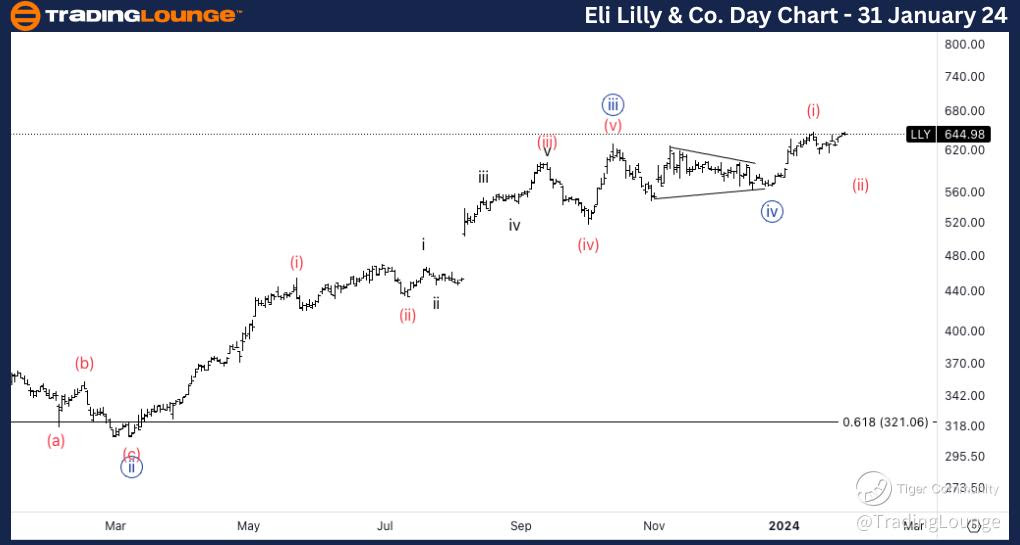
LLY Elliott Wave Analysis Trading Lounge Daily Chart, 31 January 24

Eli Lilly & Co., (LLY) Daily Chart

LLY Elliott Wave Technical Analysis

FUNCTION: Trend

MODE: Impulse

STRUCTURE: Wave {v} of 3

POSITION: Minuette wave (i) of {v}.

DIRECTION: Upside into wave {v}.

DETAILS: Looking for further upside into wave {v} as we seem to have successfully broken the previous Elliott Wave triangle in wave {iv} and we seem to be finding support on 600$.

Welcome to our Elliott Wave Analysis for Eli Lilly & Co. (LLY) as of January 31, 2024, presented by the Trading Lounge. We'll delve into the daily and 4-hour charts to provide insights into potential trading opportunities.

LLY Elliott Wave Technical Analysis - Daily Chart:

In our daily chart analysis for LLY, the current Elliott Wave structure indicates a promising trend characterized by an impulse mode. The specific wave under consideration is Wave {v} of 3, situated within the Minuette wave (i) of {v}. The prevailing direction is on the upside into wave {v}. The analysis suggests further upside potential as we observe a successful break of the previous Elliott Wave triangle in wave {iv}, with apparent support identified around the $600 mark.

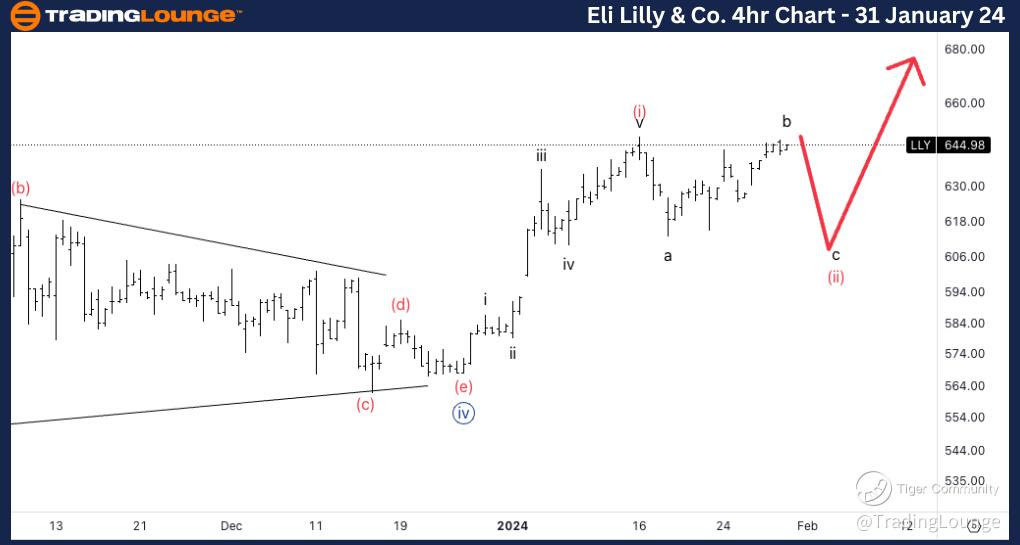
LLY Elliott Wave Analysis - 4H Chart:

Zooming in on the 4-hour chart, the Elliott Wave analysis for LLY reveals a correctional phase. The identified structure is Wave (ii) of {v}, with the current position denoted as Wave b of (ii). The anticipated direction is downside into wave c of (ii). We are ideally looking for another downward leg into wave c of (ii) before anticipating a potential upside resumption.

For traders and investors, this analysis provides valuable insights into potential entry and exit points based on Elliott Wave patterns. Stay tuned for further updates as the market dynamics evolve, and remember, successful trading requires a comprehensive understanding of the Elliott Wave principles.

If you are considering Eli Lilly & Co. as part of your portfolio, keep a close eye on these Elliott Wave patterns for informed decision-making. The Trading Lounge remains committed to providing timely and insightful technical analysis to enhance your trading strategies.

Technical Analyst: Alessio Barretta

Source: Tradinglounge.com, Learn From the Experts Join TradingLounge Here 

Previous: The Coca-Cola Company (KO)

Eli-Lilly-Day-Stock-...


LLY Elliott Wave Analysis Trading Lounge 4Hr Chart, 31 January 24

Eli Lilly & Co.,( LLY) 4Hr Chart

LLY Elliott Wave Technical Analysis

FUNCTION: Trend

MODE: Correction

STRUCTURE: Wave (ii) of {v}.

POSITION: Wave b of (ii).

DIRECTION: Downside into wave c of (ii).

DETAILS: Ideally looking for one more leg down into wave c of (ii) to then look for upside resumption.

Eli-Lilly-4Hr-Stock-...

Related

BTCUSD Elliott Wave Analysis: Bitcoin Price Prediction, Trading Strategy, Support & Resistance Levels, and Crypto Market Trends

BTCUSD Elliott Wave Analysis: Bitcoin Price Prediction, Trading Strategy, Support & Resistance Levels, and Crypto Market Trends

Bitcoin Elliott Wave Forecast with detailed BTCUSD price analysis. Our BTC/USD trading strategy expl...

Read More >
Navigating Stock Market Indices with Elliott Wave Analysis: SP500, NASDAQ 100, RUSSELL 2000, and More

Navigating Stock Market Indices with Elliott Wave Analysis: SP500, NASDAQ 100, RUSSELL 2000, and More

This blog explores the current state of major stock market indices, including the S&P 500, NASDAQ 10...

Read More >
Spotify Technology S.A. Stocks Elliott Wave Technical Analysis: Evaluate Current Trends and Forecast SPOT’s Future Price Direction

Spotify Technology S.A. Stocks Elliott Wave Technical Analysis: Evaluate Current Trends and Forecast SPOT’s Future Price Direction

This in-depth Spotify stock analysis applies Elliott Wave Theory to evaluate current trends and fore...

Read More >
 Costco Stock Market Trends and Prepare for Possible Corrections: Costco Wholesale Corp. (COST) Elliott Wave Technical Analysis

Costco Stock Market Trends and Prepare for Possible Corrections: Costco Wholesale Corp. (COST) Elliott Wave Technical Analysis

Explore our latest Elliott Wave analysis for Costco Wholesale Corp. (COST) to uncover potential trad...

Read More >
Learn About the ASX WBC Share Price Forecasts, and Technical Chart Updates For Westpac Banking Corporation Elliott Wave Analysis

Learn About the ASX WBC Share Price Forecasts, and Technical Chart Updates For Westpac Banking Corporation Elliott Wave Analysis

Our detailed Elliott Wave analysis will give valuable insights into ASX: Westpac Banking Corporation...

Read More >
S&P 500 ELLIOTT WAVE ANALYSIS, 20 JAN 2022

S&P 500 ELLIOTT WAVE ANALYSIS, 20 JAN 2022

S&P500 Expect support at 4500, but eventually expect the market to move through this Minor Level and...

Read More >

Buy 1 Month

Get 3 Months!

Special Offer:

Trade Recommendations

Unleash the power of deversified trading with our comprehensive portfolio, covering:

  • Stock Trades
  • Crypto Trades
  • Forex Trades
  • Commodity Trades
Elliott Wave Analysis

Gain a competive edge with expert insights in to:

  • Global Indices
  • US Stocks & ASX Stocks
  • Forex & Crypto
  • Commodities
Top-Notch Trading Tools

Equip yourself with the tools of success:

  • Social Chat
  • Elliott Wave Algorithm
  • Screener
  • TradingLevels
  • Trading Game
7 Elliott Wave Analysts

Stay ahead of the market with daily charts and insightful videos
-Your secret to strategic trading!

JOIN HERE


Welcome to TradingLounge (ASIC A.R.No. 321187), specialists in trades, trading education and technical analysis, covering stocks, indices, commodities, forex and cryptocurrencies.

When you join TradingLounge you have access to everything we offer, including trade tools, educational content and a social platform to chat with like-minded investors.

Read more

@Copyright 2024 by tradinglounge.com

Contact Us

Australian no: 02 4787 6020

International no: +61 (2) 47876020

Pay with:

Find us on