14Apr

NEO/USD Elliott Wave Technical Analysis Predicts Wave 3 Breakout with Bullish Targets Above $5.75 and Support Set at $4.36

NEO/USD Elliott Wave Analysis – TradingLounge Daily Chart

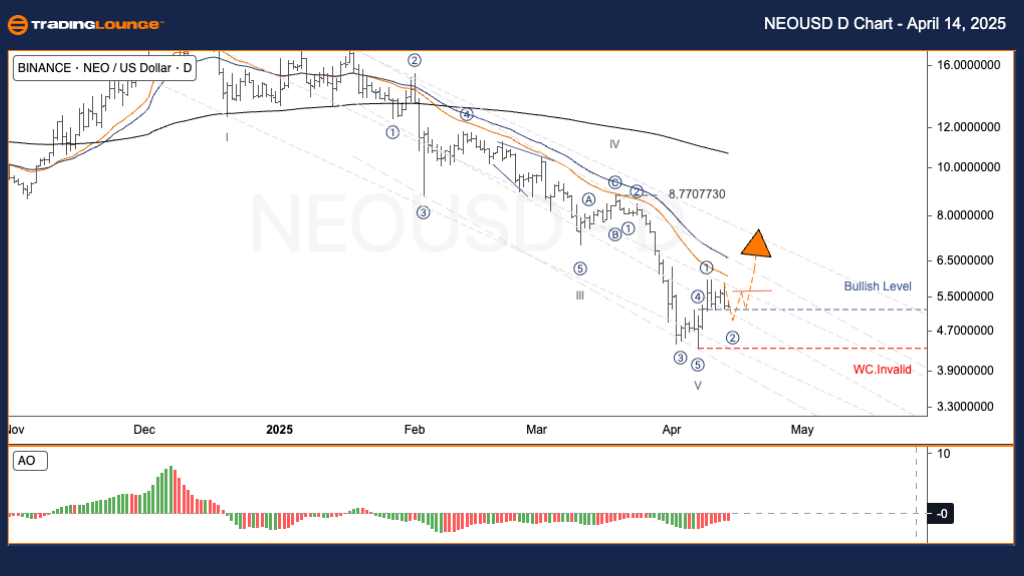
NEO/USD Daily Chart Analysis

NEO/USD Elliott Wave Technical Analysis

Function: Counter Trend

Mode: Corrective

Structure: Zigzag

Position: Wave ((C))

Direction Next Higher Degrees: Wave Y

Wave Cancel Invalid Level: $4.36

NEO/USD Trading Strategy Overview:

After falling sharply from the $22 range down to the $4.50 zone, NEO/USD appears to have completed a significant Elliott Wave corrective pattern, potentially setting up for a bullish impulsive move—Wave 3. This shift marks a key turning point in the NEO technical analysis landscape.

📌 Key Resistance – Bullish Breakout Confirmation: $5.75
A decisive move above this level would confirm Wave 3 initiation in the Elliott Wave sequence, offering a bullish trade setup.

📌 Key Support – Wave Count Invalidation: $4.36
A close below this level would invalidate the current Elliott Wave structure and suggest an alternative corrective formation is unfolding.

📌 Wave 3 Upside Targets:
Projected resistance lies at $7.50 and $8.77, corresponding to the prior Wave IV high, offering strong potential for bullish continuation.

Trading Strategy for NEO/USD:

✅ Swing Trading Approach:
If price consolidates above $5.00 and holds within the established support zone, swing traders may position for a bullish breakout, aligning with the beginning of Wave 3.

⚠️ Risk Management Guidance:
A break below $4.36 requires reassessment of the wave count and suggests that the correction may not yet be over.

NEOUSD-Crypto-Day-Ch...


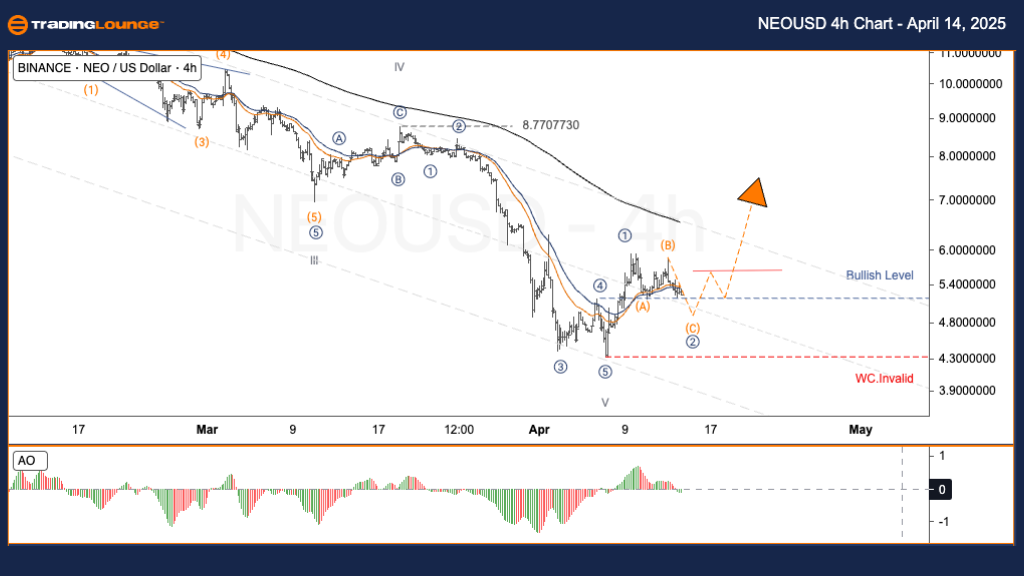
NEO/USD Elliott Wave Analysis – TradingLounge 4H Chart

Function: Counter Trend

Mode: Corrective

Structure: Zigzag

Position: Wave ((C))

Direction Next Higher Degrees: Wave Y

Wave Cancel Invalid Level: $4.36

The 4-hour NEO/USD Elliott Wave chart confirms the daily outlook, signaling the probable completion of the corrective Zigzag pattern. All previously noted key technical levels—$5.75 resistance and $4.36 invalidation—remain valid, reinforcing the near-term trading setup and bullish Elliott Wave outlook for NEO.

Technical Analyst: Kittiampon Somboonsod, CEWA

Source: Visit Tradinglounge.com and learn from the Experts Join TradingLounge Here 

Previous: AUDUSD Elliott Wave Technical Analysis

VALUE Offer - Buy 1 Month & Get 3 Months!Click here

Access 7 Analysts Over 200 Markets Covered. Chat Room With Support

NEOUSD-Crypto-4h-Cha...

Related

Explore our detailed ASX RIO TINTO LIMITED - RIO Stock Analysis & Elliott Wave Technical Forecast

Explore our detailed ASX RIO TINTO LIMITED - RIO Stock Analysis & Elliott Wave Technical Forecast

Explore our detailed ASX RIO Tinto Elliott Wave analysis and stock forecast. Learn about RIO TINTO L...

Read More >
Dynamics Between U.S.Dollar /Canadian Dollar (USD/CAD) Forex Elliott Wave Technical Analysis

Dynamics Between U.S.Dollar /Canadian Dollar (USD/CAD) Forex Elliott Wave Technical Analysis

This article provides a detailed Elliott Wave analysis of the USD/CAD currency pair, focusing on cur...

Read More >
FTSE 100 (UK)  Elliott Wave Analysis: Insights on Bullish Trends, Orange Wave 5, Navy Blue Wave 3, and Invalidation Levels

FTSE 100 (UK) Elliott Wave Analysis: Insights on Bullish Trends, Orange Wave 5, Navy Blue Wave 3, and Invalidation Levels

Elliott Wave Analysis of the FTSE 100 index, highlighting bullish trends in both daily and weekly ch...

Read More >
Looking to Buy the Best NASDAQ Stocks or Explore NDX ETFs With NASDAQ Index Elliott Wave Technical Analysis

Looking to Buy the Best NASDAQ Stocks or Explore NDX ETFs With NASDAQ Index Elliott Wave Technical Analysis

Gain valuable insights into NASDAQ Composite trading with our Elliott Wave analysis. Discover expert...

Read More >
Comprehensive Elliott Wave Analysis: S&P 500, NASDAQ, and Key Indices

Comprehensive Elliott Wave Analysis: S&P 500, NASDAQ, and Key Indices

This comprehensive analysis covers key stock market indices, including the S&P 500, NASDAQ 100, and ...

Read More >

$1 for 2 Weeks

then $29 a month!

What a Special Offer!

Trade Recommendations

Unleash the power of deversified trading with our comprehensive portfolio, covering 250+ markets:

  • Stock Trades
  • Crypto Trades
  • Forex Trades
  • Commodity Trades
Elliott Wave Analysis

Gain a competitive edge with expert insights and AI-powered Elliott Wave charting into:

  • Global Indices
  • US Stocks & ASX Stocks
  • Forex & Crypto
  • Commodities
Top-Notch Trading Tools

Equip yourself with the tools of success:

  • Real-time Chat rooms
  • Elliott Wave Algorithm
  • Portfolio tools
  • TradingLevels
  • Screener
  • Trading Game
7 Elliott Wave Analysts

Stay ahead of the market with daily charts and insightful videos
Your secret to strategic trading!

JOIN HERE


Welcome to TradingLounge (ASIC A.R.No. 321187), specialists in trades, trading education and technical analysis, covering stocks, indices, commodities, forex and cryptocurrencies.

When you join TradingLounge you have access to everything we offer, including trade tools, educational content and a social platform to chat with like-minded investors.

Read more

@Copyright 2024 by tradinglounge.com

Contact Us

Australian no: 02 4787 6020

International no: +61 (2) 47876020

Pay with:

Find us on