ASX: REA GROUP LTD – REA Elliott Elliott Wave Technical Analysis TradingLounge (1D Chart)

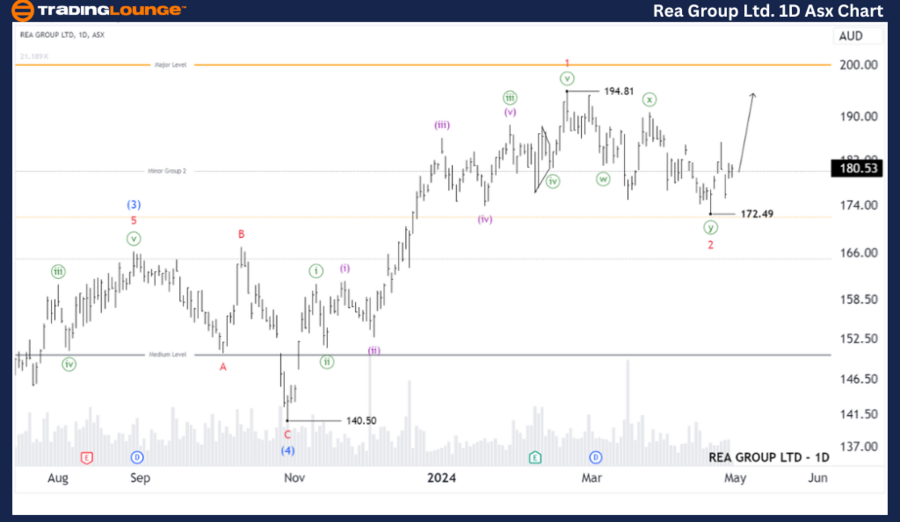
Greetings, Our Elliott Wave analysis today updates the Australian Stock Exchange (ASX) with REA GROUP LTD – REA. We identified that wave 2-red may have just ended, and wave 3-red could push much higher.

ASX: REA GROUP LTD – REA Elliott Wave Technical Analysis  

ASX: REA GROUP LTD – REA 1D Chart (Semilog Scale) Analysis

Function: Major trend (Minor degree, red)

Mode: Motive

Structure: Impulse

Position: Wave 3-red

Details: The short-term outlook suggests that the 2-red wave appears to have recently completed as a Double Zigzag correction, and the 3-red wave may be ready to push higher. Further upward movement would confirm this outlook.

Invalidation point: 140.50

Rea-Group-ltd-1D-asx...


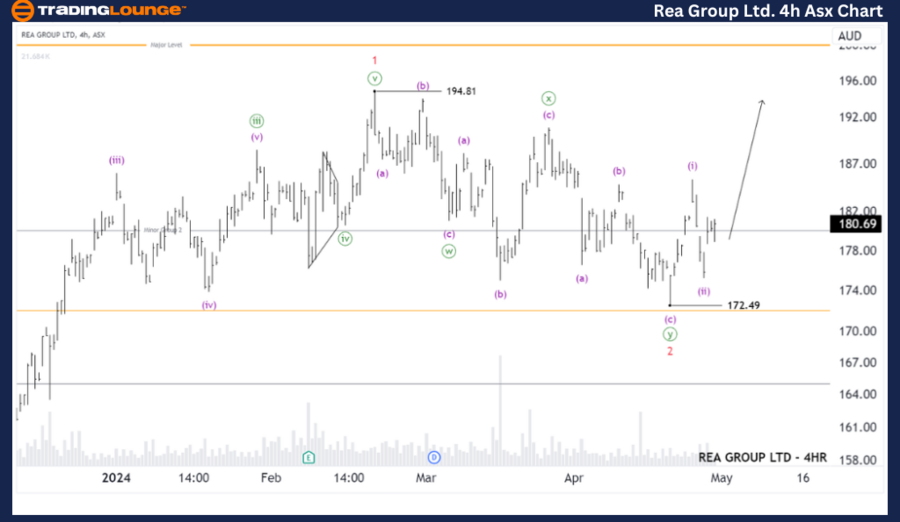
ASX: REA GROUP LTD – REA Elliott Wave Technical Analysis TradingLounge (4-Hour Chart)

ASX: REA GROUP LTD – REA Elliott Wave Technical Analysis

ASX: REA GROUP LTD – REA 4-Hour Chart Analysis

Function: Major trend (Minuette degree, purple)

Mode: Motive

Structure: Impulse

Position: Wave (iii)-purple

Details: The near-term outlook suggests that the 2-red wave has concluded in the form of a Double Zigzag pattern at the low of 172.49, allowing for the possibility of the 3-red wave to resume and push higher. Currently, it is subdivided into the (i) and (ii)-purple waves, and it appears that the (ii)-purple wave has recently ended. The (iii)-purple wave may now be unfolding to push higher.

Invalidation point: 172.49

Technical Analyst: Hua (Shane) Cuong, CEWA-M (Master’s Designation).

Source: visit Tradinglounge.com and learn From the Experts Join TradingLounge Here 

Previous: ASX: WISETECH GLOBAL LIMITED – WTC Elliott Wave Technical Analysis

Special Trial Offer - 0.76 Cents a Day for 3 Months! Click here

Access 6 Analysts covering over 150 Markets. Chat Room With Support

Rea-Group-ltd-4h-asx...

Conclusion:  

Our analysis, forecast of contextual trends, and short-term outlook for ASX: REA GROUP LTD – REA aim to provide readers with insights into the current market trends and how to capitalize on them effectively. We offer specific price points that act as validation or invalidation signals for our wave count, enhancing the confidence in our perspective. By combining these factors, we strive to offer readers the most objective and professional perspective on market trends.

Related

In-depth look at the EUR/GBP Currency Pair using the Elliott Wave Theory: Insights into Potential Forex Market Movements

In-depth look at the EUR/GBP Currency Pair using the Elliott Wave Theory: Insights into Potential Forex Market Movements

This analysis provides an in-depth look at the EUR/GBP currency pair using the Elliott Wave theory. ...

Read More >
Gold Elliott Wave Analysis: Bullish Trend Towards $3,000 with Possible Pullbacks Creating new Buying Opportunities

Gold Elliott Wave Analysis: Bullish Trend Towards $3,000 with Possible Pullbacks Creating new Buying Opportunities

Gold is in a strong bullish trend, with Elliott Wave analysis indicating further upside potential. T...

Read More >
S&P 500 Elliott Wave Technical Analysis: Forecasts, Trading Strategies, and Market Trends for Successful Stock Trading

S&P 500 Elliott Wave Technical Analysis: Forecasts, Trading Strategies, and Market Trends for Successful Stock Trading

S&P 500 Elliott Wave Analysis including day and weekly charts. Understand wave patterns like impulse...

Read More >
TSLA Stock Forecast: Tesla Elliott Wave Technical Analysis & Key Price Levels

TSLA Stock Forecast: Tesla Elliott Wave Technical Analysis & Key Price Levels

This comprehensive Elliott Wave analysis of Tesla Inc. (TSLA) provides an in-depth look at both dail...

Read More >
Bullish CAC 40 Elliott Wave Analysis: Daily Orange Wave 3 & Weekly Navy Blue Wave 1 Confirm Uptrend Above 6771 Support Level

Bullish CAC 40 Elliott Wave Analysis: Daily Orange Wave 3 & Weekly Navy Blue Wave 1 Confirm Uptrend Above 6771 Support Level

This analysis explores the CAC 40’s bullish Elliott Wave progression on daily and weekly charts. Or...

Read More >
State Bank of India Stocks Elliott Wave Technical Analysis: Interpret Current Trends and Potential Future Price Movements

State Bank of India Stocks Elliott Wave Technical Analysis: Interpret Current Trends and Potential Future Price Movements

This in-depth technical analysis for the State Bank of India (SBIN) uses the Elliott Wave method to ...

Read More >

$1 for 2 Weeks

then $29 a month!

What a Special Offer!

Trade Recommendations

Unleash the power of deversified trading with our comprehensive portfolio, covering 250+ markets:

  • Stock Trades
  • Crypto Trades
  • Forex Trades
  • Commodity Trades
Elliott Wave Analysis

Gain a competitive edge with expert insights and AI-powered Elliott Wave charting into:

  • Global Indices
  • US Stocks & ASX Stocks
  • Forex & Crypto
  • Commodities
Top-Notch Trading Tools

Equip yourself with the tools of success:

  • Real-time Chat rooms
  • Elliott Wave Algorithm
  • Portfolio tools
  • TradingLevels
  • Screener
  • Trading Game
7 Elliott Wave Analysts

Stay ahead of the market with daily charts and insightful videos
Your secret to strategic trading!

JOIN HERE


Welcome to TradingLounge (ASIC A.R.No. 321187), specialists in trades, trading education and technical analysis, covering stocks, indices, commodities, forex and cryptocurrencies.

When you join TradingLounge you have access to everything we offer, including trade tools, educational content and a social platform to chat with like-minded investors.

Read more

@Copyright 2024 by tradinglounge.com

Contact Us

Australian no: 02 4787 6020

International no: +61 (2) 47876020

Pay with:

Find us on