ASX: WISETECH GLOBAL LIMITED - WTC Elliott Elliott Wave Technical Analysis TradingLounge (1D Chart)

Greetings, Our Elliott Wave analysis today updates the Australian Stock Exchange (ASX) WISETECH GLOBAL LIMITED – WTC. We have determined that wave (iv)-purple has ended and wave (v)-purple is opened to push higher.

ASX: WISETECH GLOBAL LIMITED – WTC Elliott Wave Technical Analysis  

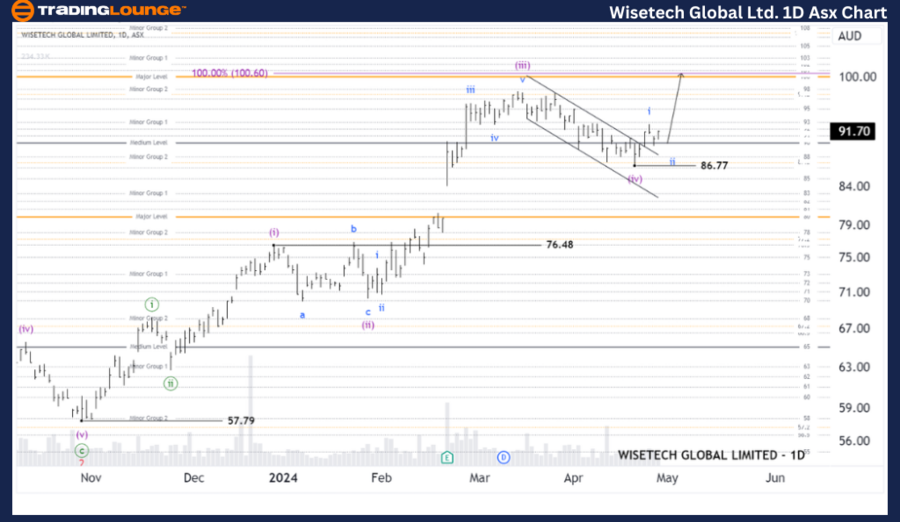
ASX: WISETECH GLOBAL LIMITED – WTC Chart (Semilog Scale) Analysis

Function: Major trend (Minute degree, green)
Mode: Motive
Structure: Impulse
Position: Wave (v)-purple of Wave ((iii))-green
Details: The short-term outlook indicates that the (iv)-purple wave has just concluded, and the (v)-purple wave may unfold to push higher, targeting 100.60. It's crucial for the price to consistently remain above the level of 86.77 to support this perspective.
Invalidation point: 76.48

WISETECH-GLOBAL-LIMI...


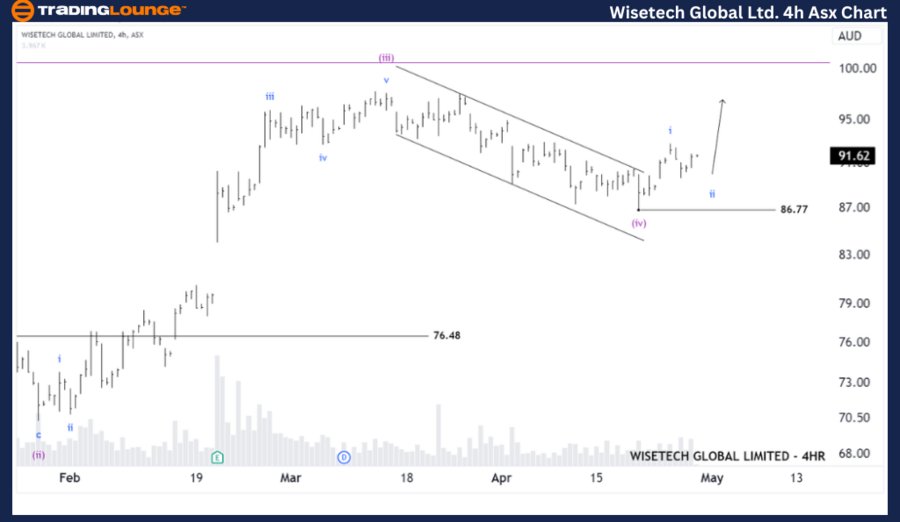
ASX: WISETECH GLOBAL LIMITED – WTC Elliott Wave Technical Analysis TradingLounge (4-Hour Chart)

ASX: WISETECH GLOBAL LIMITED – WTC Elliott Wave Technical Analysis

ASX: WISETECH GLOBAL LIMITED – WTC 4-Hour Chart Analysis

Function: Major trend (Subminuette, blue)
Mode: Motive
Structure: Impulse  
Position: Wave ii-blue

Details: The short-term outlook suggests that the (iv)-purple wave has recently completed, and now it's time for the (v)-purple wave to unfold upwards. It's currently subdividing into the i and ii-blue waves, with the iii-blue wave potentially resuming soon to continue pushing higher, targeting 100.00.
Invalidation point: 86.77

Conclusion:  

Our analysis, forecast of contextual trends, and short-term outlook for ASX: WISETECH GLOBAL LIMITED – WTC aim to provide readers with insights into the current market trends and how to capitalize on them effectively. We offer specific price points that act as validation or invalidation signals for our wave count, enhancing the confidence in our perspective. By combining these factors, we strive to offer readers the most objective and professional perspective on market trends.

Technical Analyst: Hua (Shane) Cuong, CEWA-M (Master’s Designation).

Source: visit Tradinglounge.com and learn From the Experts Join TradingLounge Here 

Previous: ASX: NATIONAL AUSTRALIA BANK LIMITED - NAB 

Special Trial Offer - 0.76 Cents a Day for 3 Months!  Click here
Access 6 Analysts covering over 150 Markets. Chat Room With Support

WISETECH-GLOBAL-LIMI...

Related

Commodity Market Elliott Wave Analysis: Bitcoin, Ethereum, Bonds, Yields, Gold, Silver, Copper, Uranium, Crude Oil, Natural Gas

Commodity Market Elliott Wave Analysis: Bitcoin, Ethereum, Bonds, Yields, Gold, Silver, Copper, Uranium, Crude Oil, Natural Gas

Bitcoin and Ethereum are expected to climb higher. TLT Bonds and US 10 Yr. Yields suggest a potentia...

Read More >
NEO Elliott Wave Forecast Reveals Bullish Trade Setup With Wave III Breakout Signal on Daily and H4 Technical Analysis Charts

NEO Elliott Wave Forecast Reveals Bullish Trade Setup With Wave III Breakout Signal on Daily and H4 Technical Analysis Charts

Discover a potential bullish reversal in NEO using Elliott Wave analysis. Daily and H4 charts signal...

Read More >
NEE Elliott Wave Analysis: Explore NextEra Energy Stock Trends, Flat Structures, and Bullish Reversal Forecasts

NEE Elliott Wave Analysis: Explore NextEra Energy Stock Trends, Flat Structures, and Bullish Reversal Forecasts

Elliott Wave analysis of NextEra Energy (NEE) examines current stock trends, focusing on wave C corr...

Read More >
Cocoa Commodity Analysis & Elliott Wave Technical Forecast: Navigating the Bullish Waves

Cocoa Commodity Analysis & Elliott Wave Technical Forecast: Navigating the Bullish Waves

This comprehensive analysis provides a deep dive into the cocoa market's bullish trend, leveragi...

Read More >
Berkshire Hathaway Inc. (BRK.B) Elliott Wave Analysis: Stock Forecast, Trend Outlook, and Technical Analysis for Bullish Momentum

Berkshire Hathaway Inc. (BRK.B) Elliott Wave Analysis: Stock Forecast, Trend Outlook, and Technical Analysis for Bullish Momentum

Berkshire Hathaway (BRK.B) remains in an impulsive Elliott Wave structure, progressing through Wave ...

Read More >
CAC 40 Index Elliott Wave Technical Analysis: Key Insights for Trading and Investing in the French Stock Index

CAC 40 Index Elliott Wave Technical Analysis: Key Insights for Trading and Investing in the French Stock Index

This article dives into CAC 40 trading strategies, with an Elliott Wave analysis to guide investors ...

Read More >

Buy 1 Month

Get 3 Months!

Special Offer:

Trade Recommendations

Unleash the power of deversified trading with our comprehensive portfolio, covering:

  • Stock Trades
  • Crypto Trades
  • Forex Trades
  • Commodity Trades
Elliott Wave Analysis

Gain a competive edge with expert insights in to:

  • Global Indices
  • US Stocks & ASX Stocks
  • Forex & Crypto
  • Commodities
Top-Notch Trading Tools

Equip yourself with the tools of success:

  • Social Chat
  • Elliott Wave Algorithm
  • Screener
  • TradingLevels
  • Trading Game
7 Elliott Wave Analysts

Stay ahead of the market with daily charts and insightful videos
-Your secret to strategic trading!

JOIN HERE


Welcome to TradingLounge (ASIC A.R.No. 321187), specialists in trades, trading education and technical analysis, covering stocks, indices, commodities, forex and cryptocurrencies.

When you join TradingLounge you have access to everything we offer, including trade tools, educational content and a social platform to chat with like-minded investors.

Read more

@Copyright 2024 by tradinglounge.com

Contact Us

Australian no: 02 4787 6020

International no: +61 (2) 47876020

Pay with:

Find us on