12Jun

Palo Alto Networks Stock Update: PANW Elliott Wave Analysis Shows Bullish Breakout Potential with Resistance and Extension

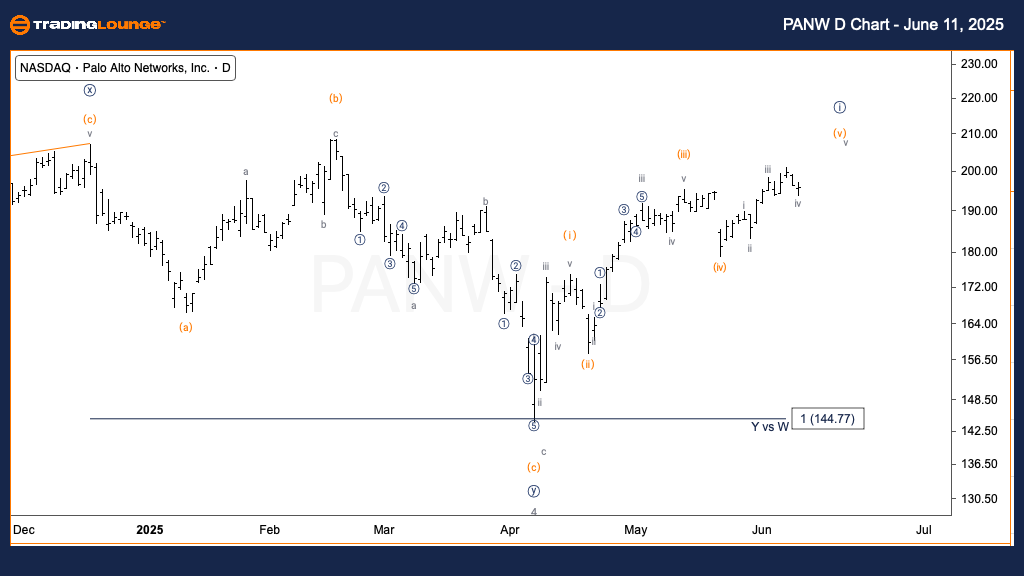
PANW Elliott Wave Analysis – TradingLounge Daily Chart

Palo Alto Networks Inc. (PANW) – Daily Chart Analysis

PANW Elliott Wave Technical Analysis

FUNCTION: Trend

MODE: Motive

STRUCTURE: Impulsive

POSITION: Wave (v) of {i}

DIRECTION: Upward movement toward Wave (v)

DETAILS: PANW stock continues to move higher, progressing into Wave (v) within a larger impulsive structure. The price is approaching a significant resistance zone near the $200 mark, aligned with Trading Level 2. This level is considered a key decision point for potential bullish continuation.

The daily Elliott Wave chart for Palo Alto Networks Inc. (PANW) illustrates a strong upward trend within an impulsive formation, with Wave (v) nearing completion under Minor Wave {i}. The $200 resistance level is technically crucial. A confirmed breakout above this resistance could open the path for extended bullish momentum.

PANW-D-Chart-110625


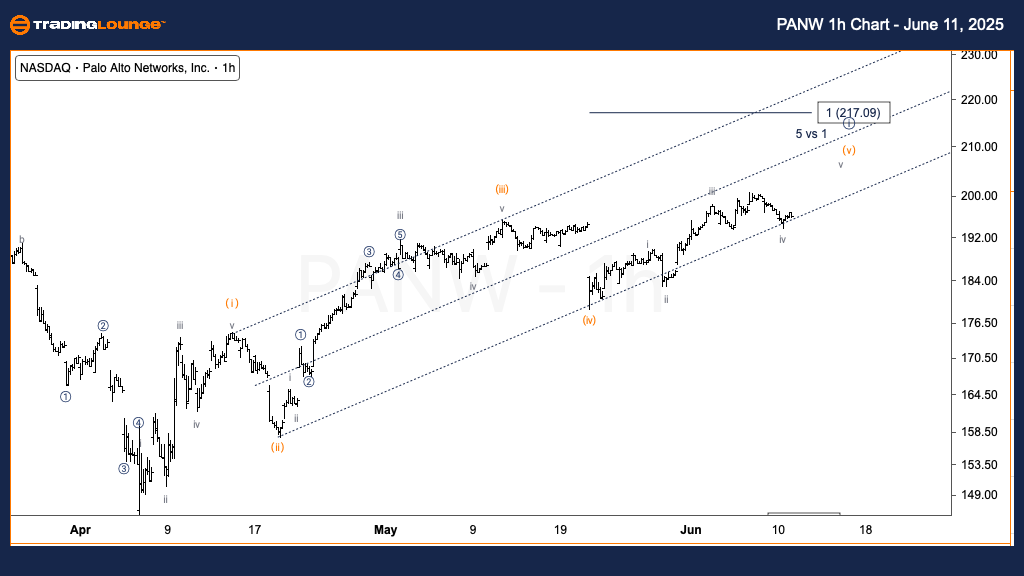
Palo Alto Networks Inc. (PANW) – 1 Hour Chart

PANW Elliott Wave Technical Analysis

FUNCTION: Trend

MODE: Motive

STRUCTURE: Impulsive

POSITION: Wave v of (v)

DIRECTION: Continuing upward in Wave v

DETAILS: The price has rebounded from the support line of the parallel channel formed by Wave (iv). Currently, PANW is advancing in Wave v, with the immediate target set at $200. If Wave (v) mirrors the length of Wave (i), the next projected resistance lies at $217.

The 1-hour Elliott Wave analysis confirms the bullish trend, supported by a successful retest of channel support. With Wave (v) unfolding, the price action suggests a short-term bullish outlook toward $200. A further extension toward $217 remains a viable scenario if wave symmetry holds, reinforcing the current bullish momentum.

Technical Analyst: Alessio Barretta

Source: Visit Tradinglounge.com and learn from the Experts. Join TradingLounge Here 

Previous: Costco Wholesale Corp. (COST) Elliott Wave Technical Analysis

VALUE Offer - Buy 1 Month & Get 3 Months!Click here

Access 7 Analysts Over 200 Markets Covered. Chat Room With Support

PANW-1h-Chart-110625

Related

NEOUSD Elliott Wave Analysis: Predicting NEO Price, Identifying Key Support/Resistance Levels, and Strategic Trading Opportunities

NEOUSD Elliott Wave Analysis: Predicting NEO Price, Identifying Key Support/Resistance Levels, and Strategic Trading Opportunities

This article provides an in-depth Elliott Wave analysis of NEOUSD, highlighting potential price move...

Read More >
Gold XAUUSD Commodity Elliott Wave Analysis: Explore the Current Price Trends, Wave Structures, and Future Projections

Gold XAUUSD Commodity Elliott Wave Analysis: Explore the Current Price Trends, Wave Structures, and Future Projections

In this comprehensive Gold Elliott Wave Analysis, we explore the current price trends, wave structur...

Read More >
Examines NTPC's Recent Price Trends, Support and Resistance Levels: NTPC Stocks Elliott Wave Technical Analysis

Examines NTPC's Recent Price Trends, Support and Resistance Levels: NTPC Stocks Elliott Wave Technical Analysis

This article provides a comprehensive Elliott Wave analysis of NTPC stock, highlighting key price ta...

Read More >
Elliott Wave analysis for Coca-Cola (KO) provides a comprehensive stock forecast, Including a Price Target, and Current Trend insights

Elliott Wave analysis for Coca-Cola (KO) provides a comprehensive stock forecast, Including a Price Target, and Current Trend insights

This Elliott Wave analysis for Coca-Cola (KO) provides a comprehensive stock forecast, including a p...

Read More >
VeChain / U.S. dollar(VETUSD) Elliott Wave Technical Analysis 26 January 24

VeChain / U.S. dollar(VETUSD) Elliott Wave Technical Analysis 26 January 24

TradingLounge Daily Chart and 4-Hour Chart for VeChain/U.S. dollar Elliott Wave Technical Analysis d...

Read More >
NZDUSD Elliott Wave Analysis: Monitoring Corrective Phase and Anticipating Transition into Wave 3 for Strategic Trading Opportunities

NZDUSD Elliott Wave Analysis: Monitoring Corrective Phase and Anticipating Transition into Wave 3 for Strategic Trading Opportunities

The NZDUSD pair is currently in a corrective phase identified as Orange Wave 2, following the comple...

Read More >

$1 for 2 Weeks

then $29 a month!

What a Special Offer!

Trade Recommendations

Unleash the power of deversified trading with our comprehensive portfolio, covering 250+ markets:

  • Stock Trades
  • Crypto Trades
  • Forex Trades
  • Commodity Trades
Elliott Wave Analysis

Gain a competitive edge with expert insights and AI-powered Elliott Wave charting into:

  • Global Indices
  • US Stocks & ASX Stocks
  • Forex & Crypto
  • Commodities
Top-Notch Trading Tools

Equip yourself with the tools of success:

  • Real-time Chat rooms
  • Elliott Wave Algorithm
  • Portfolio tools
  • TradingLevels
  • Screener
  • Trading Game
7 Elliott Wave Analysts

Stay ahead of the market with daily charts and insightful videos
Your secret to strategic trading!

JOIN HERE


Welcome to TradingLounge (ASIC A.R.No. 321187), specialists in trades, trading education and technical analysis, covering stocks, indices, commodities, forex and cryptocurrencies.

When you join TradingLounge you have access to everything we offer, including trade tools, educational content and a social platform to chat with like-minded investors.

Read more

@Copyright 2024 by tradinglounge.com

Contact Us

Australian no: 02 4787 6020

International no: +61 (2) 47876020

Pay with:

Find us on