11Jun

Costco Elliott Wave Analysis Reveals Wave 2 Pullback at $1000 Support and Intraday Wave {a} Rally: Forecast For Wave 3 Setup

COST Elliott Wave Analysis – Trading Lounge Daily Chart

Costco Wholesale Corp. (COST) – Daily Chart Analysis

COST Elliott Wave Technical Analysis

FUNCTION: Counter Trend

MODE: Corrective

STRUCTURE: Flat

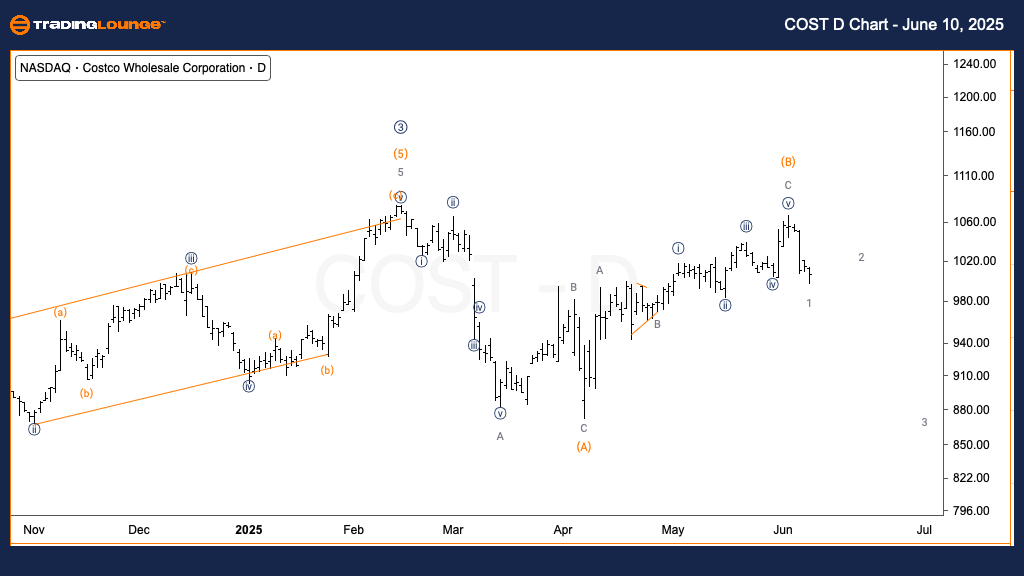
POSITION: Wave 2 of (C)

DIRECTION: Downside in Wave 2

DETAILS: The Elliott Wave setup for Costco (COST) on the daily chart shows a likely retracement in Wave 2 of (C), following a bounce off the significant $1000 support level. Bearish momentum remains inconclusive unless $1000 flips to resistance after a confirmed retest. A deeper correction in Wave 2 remains probable before initiating any move into Wave 3 of (C).

COST-us-stock-day-ch...


Costco Wholesale Corp. (COST) – 1H Chart

COST Elliott Wave Technical Analysis

FUNCTION: Counter Trend

MODE: Corrective

STRUCTURE: Flat

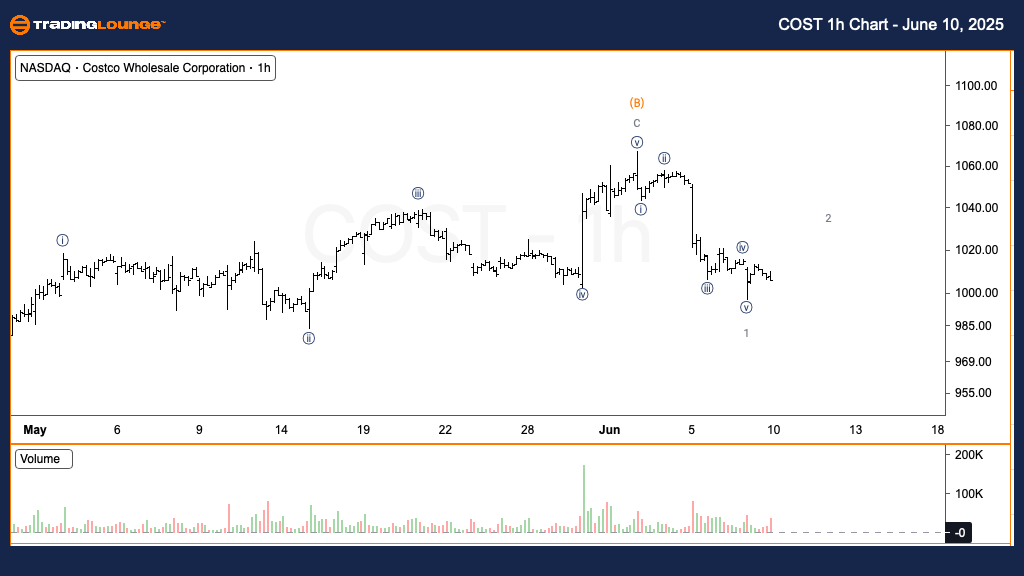
POSITION: Wave {a} of 2

DIRECTION: Upside in Wave 2

DETAILS: The 1-hour COST chart reveals a completed five-wave decline ending Minor Wave 1, signaling the onset of a corrective phase. The current upward move marks the progression of Wave {a} within Wave 2. Once Wave 2 concludes, anticipate the start of another downward five-wave impulsive leg.

Technical Analyst: Alessio Barretta

Source: Visit Tradinglounge.com and learn from the Experts. Join TradingLounge Here 

Previous: Amazon.com Inc. (AMZN) Elliott Wave Technical Analysis

VALUE Offer - Buy 1 Month & Get 3 Months!Click here

Access 7 Analysts Over 200 Markets Covered. Chat Room With Support

COST-us-stock-1h-cha...


Combined Technical Summary:

This Elliott Wave analysis combines insights from both the daily and intraday charts of Costco Wholesale Corp. (COST) to provide a clearer market perspective:

Daily Chart: Indicates a corrective Wave 2 of (C) retracement following a bounce at the key $1000 level.

1H Chart: Highlights the formation of a corrective rally in Wave {a} of 2 after a completed five-wave decline into Minor Wave 1.

Related

U.S. Dollar / Japanese Yen (USDJPY) Elliott Wave Analysis: Price Prediction, Wave Count & Forex Trading Strategy for Market Outlook

U.S. Dollar / Japanese Yen (USDJPY) Elliott Wave Analysis: Price Prediction, Wave Count & Forex Trading Strategy for Market Outlook

This USDJPY Elliott Wave Analysis provides insights into the bearish trend, wave counts, and key sup...

Read More >
Forex Traders Can Gain Insights into Upcoming EURGBP Trends: Euro/British Pound Forex Elliott Wave Technical Analysis

Forex Traders Can Gain Insights into Upcoming EURGBP Trends: Euro/British Pound Forex Elliott Wave Technical Analysis

This article provides an in-depth EURGBP Elliott Wave analysis, focusing on both daily and 4-hour ch...

Read More >
NIFTY 50 Elliott Wave Technical Analysis for 2025: Corrective Waves, Trend Reversals, Expanded Flat Patterns, and Key Price Levels

NIFTY 50 Elliott Wave Technical Analysis for 2025: Corrective Waves, Trend Reversals, Expanded Flat Patterns, and Key Price Levels

NIFTY 50 index uses Elliott Wave principles to forecast key market movements, including corrective w...

Read More >
Looking for the latest AAVE/ U.S. dollar Crypto Pair Price Forecast - AAVEUSD Elliott Wave Technical Analysis and Insights

Looking for the latest AAVE/ U.S. dollar Crypto Pair Price Forecast - AAVEUSD Elliott Wave Technical Analysis and Insights

Looking for the latest AAVE price forecast? This in-depth AAVE Elliott Wave analysis covers AAVEUSD ...

Read More >
 GBPJPY Elliott Wave Technical Analysis - Offering Valuable Technical Perspectives for British Pound/Japanese Yen Currency Pairs

GBPJPY Elliott Wave Technical Analysis - Offering Valuable Technical Perspectives for British Pound/Japanese Yen Currency Pairs

This article provides an in-depth Elliott Wave analysis of the GBPJPY market, highlighting key wave ...

Read More >
ASX: Northern Star Resources (NST) Elliott Wave Technical Analysis, Stock Forecast, Support & Resistance Levels for Traders

ASX: Northern Star Resources (NST) Elliott Wave Technical Analysis, Stock Forecast, Support & Resistance Levels for Traders

This Elliott Wave technical analysis of ASX: Northern Star Resources Ltd (NST) provides insights int...

Read More >

$1 for 2 Weeks

then $29 a month!

What a Special Offer!

Trade Recommendations

Unleash the power of deversified trading with our comprehensive portfolio, covering 250+ markets:

  • Stock Trades
  • Crypto Trades
  • Forex Trades
  • Commodity Trades
Elliott Wave Analysis

Gain a competitive edge with expert insights and AI-powered Elliott Wave charting into:

  • Global Indices
  • US Stocks & ASX Stocks
  • Forex & Crypto
  • Commodities
Top-Notch Trading Tools

Equip yourself with the tools of success:

  • Real-time Chat rooms
  • Elliott Wave Algorithm
  • Portfolio tools
  • TradingLevels
  • Screener
  • Trading Game
7 Elliott Wave Analysts

Stay ahead of the market with daily charts and insightful videos
Your secret to strategic trading!

JOIN HERE


Welcome to TradingLounge (ASIC A.R.No. 321187), specialists in trades, trading education and technical analysis, covering stocks, indices, commodities, forex and cryptocurrencies.

When you join TradingLounge you have access to everything we offer, including trade tools, educational content and a social platform to chat with like-minded investors.

Read more

@Copyright 2024 by tradinglounge.com

Contact Us

Australian no: 02 4787 6020

International no: +61 (2) 47876020

Pay with:

Find us on