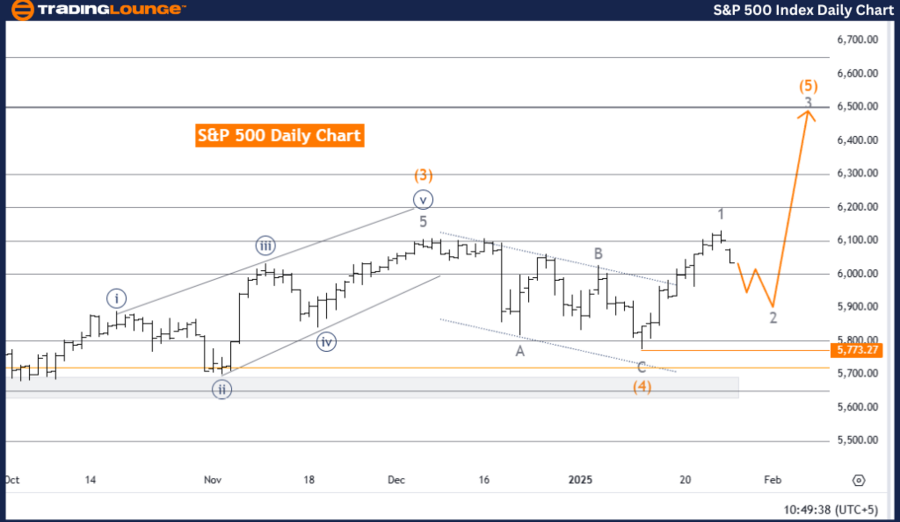
S&P 500 Elliott Wave Analysis: Trading Lounge Daily Chart
S&P 500 Elliott Wave Technical Analysis
Technical Overview
Function: Counter Trend
Mode: Corrective
Structure: Gray Wave 2
Position: Orange Wave 5
Next Higher Degree Direction: Gray Wave 3
Details:
Gray Wave 1 appears completed.
Gray Wave 2 is currently active.
Wave Invalidation Level: 5,773.27
This Elliott Wave analysis of the S&P 500 daily chart focuses on identifying a counter-trend correction, currently represented by Gray Wave 2. Following the completion of Gray Wave 1, the index is experiencing a corrective phase, signaling a temporary pause in the broader uptrend.
The market is currently positioned within Orange Wave 5, which concluded the previous Gray Wave 1 structure. With Gray Wave 2 unfolding, the index is undergoing a consolidation phase before the expected upward movement resumes through Gray Wave 3.
The critical invalidation level is set at 5,773.27, which serves as an essential reference point. A decline below this level would require a reassessment of the Elliott Wave count and a potential shift in market outlook.
Summary
The S&P 500 daily chart analysis highlights an ongoing corrective phase within Gray Wave 2, following the completion of Gray Wave 1. This phase offers an opportunity to evaluate market trends before the anticipated continuation of the uptrend through Gray Wave 3. The invalidation level of 5,773.27 remains a key risk management metric, ensuring alignment with wave structure and strategic planning. This analysis provides valuable insights into the market’s corrective behavior and serves as a guide for potential bullish continuation in line with Elliott Wave Theory.
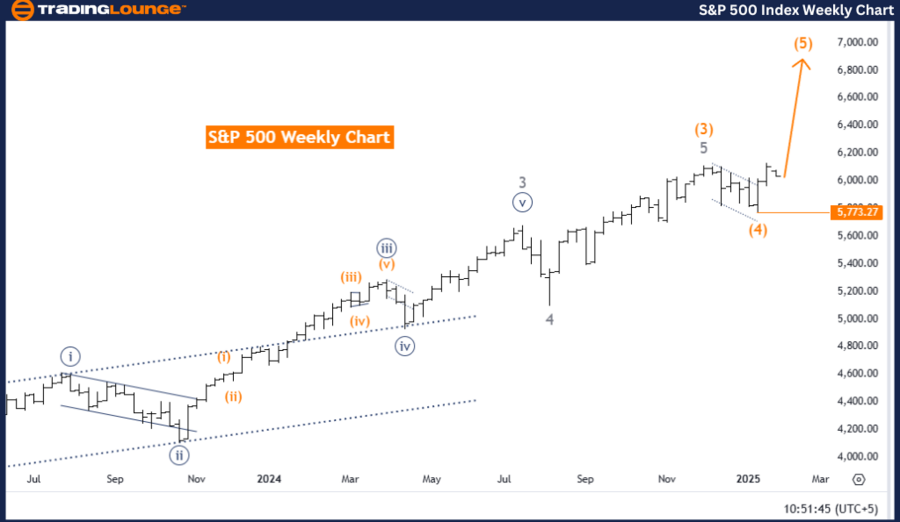
S&P 500 Elliott Wave Analysis: Trading Lounge Weekly Chart
S&P 500 Elliott Wave Technical Analysis
Technical Overview
Function: Bullish Trend
Mode: Impulsive
Structure: Orange Wave 5
Position: Navy Blue Wave 1
Next Higher Degree Direction: Orange Wave 5 (Initiated)
Details:
Orange Wave 4 appears completed.
Orange Wave 5 is currently active.
Wave Invalidation Level: 5,773.27
This Elliott Wave analysis of the S&P 500 weekly chart indicates a bullish trend with an impulsive structure. The index is currently within Orange Wave 5, which has started following the completion of Orange Wave 4, signaling the continuation of the broader uptrend.
The market is positioned within Navy Blue Wave 1, a critical component of the larger Orange Wave 5 structure. The conclusion of Orange Wave 4 marks the end of the previous corrective phase, and the development of Orange Wave 5 is expected to drive bullish momentum, supporting further market growth.
The invalidation level is set at 5,773.27, serving as a crucial benchmark. A movement below this level would invalidate the current wave count, prompting a reevaluation of market expectations and strategy adjustments.
Summary
The weekly S&P 500 chart analysis emphasizes an ongoing bullish trend driven by the completion of Orange Wave 4 and the initiation of Orange Wave 5. The market's position within Navy Blue Wave 1 suggests a renewed upward trajectory, in line with higher-degree impulsive movements. The invalidation level of 5,773.27 provides a critical reference for traders to monitor risk and validate the wave count. This analysis offers crucial insights into the market’s bullish outlook, enabling traders to align their strategies effectively while tracking key levels for potential market adjustments.
Technical Analyst: Malik Awais
Source: visit Tradinglounge.com and learn From the Experts Join TradingLounge Here
Previous: FTSE 100 (UK) Elliott Wave Technical Analysis
VALUE Offer - Buy 1 Month & Get 3 Months!Click here
Access 7 Analysts Over 200 Markets Covered. Chat Room With Support