Welcome to our latest Elliott Wave analysis for Meta Platforms Inc. (META). This analysis provides an in-depth look at META's price movements using the Elliott Wave Theory, helping traders identify potential opportunities based on current trends and market structure. We will cover insights from both the daily and 4-hour charts to offer a comprehensive perspective on META's market behavior.
META Elliott Wave Analysis Trading Lounge Daily Chart
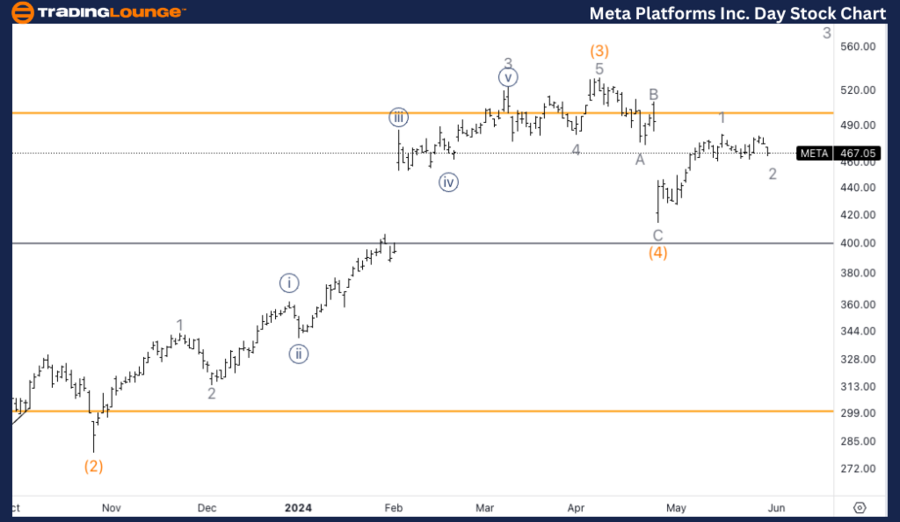
Meta Platforms Inc. (META) Daily Chart Analysis
META Elliott Wave Technical Analysis
Function: Trend
Mode: Impulsive
Structure: Motive
Position: Minor 2
Direction: Upside in 3 of (5)
Details: Looking for a bottom in place in wave (4), looking to start trading above TL5 at $500.
META Elliott Wave Technical Analysis – Daily Chart
In our Elliott Wave analysis of Meta Platforms Inc. (META), we observe an impulsive trend characterized by a motive structure. META is currently positioned in Minor wave 2, indicating an upside movement in wave 3 of (5). We are looking for a bottom to be in place in wave (4) and anticipate trading above TL5 at $500. Traders should monitor this level for confirmation of the upward trend resumption.

META Elliott Wave Analysis Trading Lounge 4Hr Chart
Meta Platforms Inc. (META) 4Hr Chart
META Elliott Wave Technical Analysis
Function: Trend
Mode: Impulsive
Structure: Motive
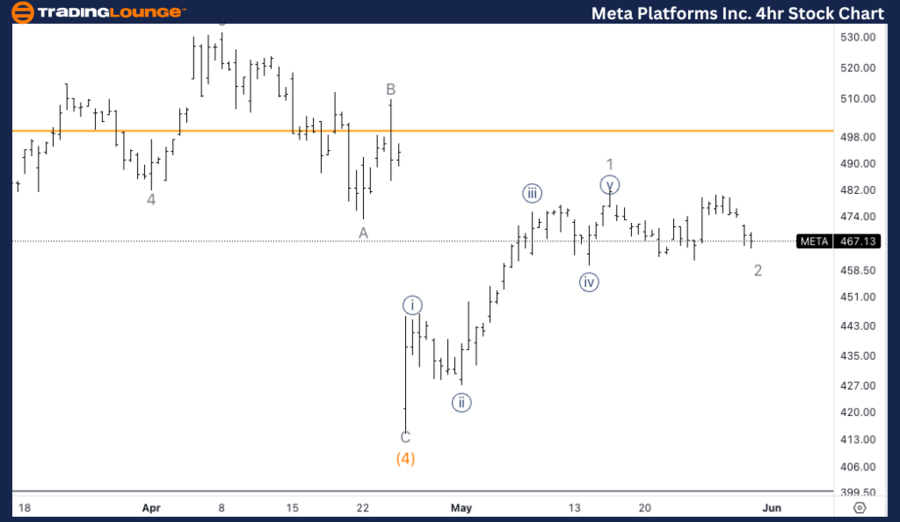
Position: Wave {c} of 2
Direction: Upside in 3
Details: We can identify five waves to the upside into wave 1 and a three-wave move in wave 2. Looking for a turn soon as we are entering a zone of demand.
META Elliott Wave Technical Analysis – 4Hr Chart
On the 4-hour chart, META is following an impulsive trend within a motive structure, specifically in wave {c} of 2. The analysis reveals five waves to the upside into wave 1, followed by a three-wave corrective move in wave 2. As we enter a demand zone, we are looking for a bullish turn soon, indicating the start of wave 3. This phase provides a strategic entry point for long positions, aligning with the overall bullish outlook.
Technical Analyst: Alessio Barretta
Source: visit Tradinglounge.com and learn From the Experts Join TradingLounge Here
See Previous: VanEck Semiconductor ETF (SMH) Stocks Elliott Wave Technical Analysis
Special Trial Offer - 0.76 Cents a Day for 3 Months! Click here
Access 7 Analysts Over 170 Markets Covered. Chat Room With Support
