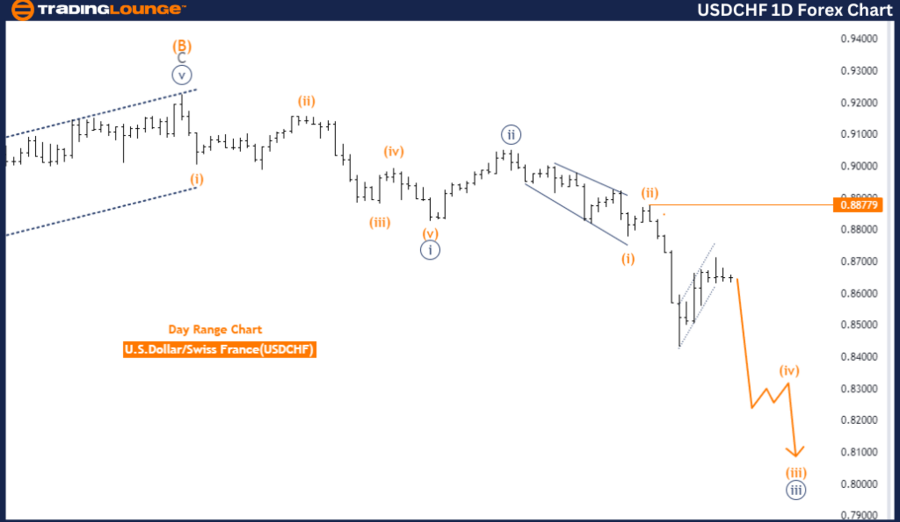
USDCHF Elliott Wave Analysis - Trading Lounge Day Chart
U.S. Dollar / Swiss Franc (USDCHF) Day Chart Analysis
USDCHF Elliott Wave Technical Analysis
Function: Trend
Mode: Impulsive
Structure: Orange wave 3
Position: Navy blue wave 3
Direction Next Higher Degrees: Orange wave 4
Details: Orange wave 2 appears completed; now, orange wave 3 is in play.
Wave Cancel Invalid Level: 0.88779
The daily chart analysis of USDCHF, focusing on Elliott Wave theory, highlights an ongoing downward trend characterized by the impulsive nature of orange wave 3. This wave structure points to a sustained bearish momentum. The market is currently in the crucial navy blue wave 3 phase, which plays a pivotal role in the Elliott Wave sequence, indicating a significant ongoing decline.
Previously, the market completed orange wave 2, a corrective phase that momentarily halted the preceding upward trend. With the conclusion of wave 2, the market has now entered orange wave 3, which is driving prices lower. This shift from wave 2 to wave 3 typically signifies the start of a more potent market movement, as wave 3 is usually the most forceful and extended wave in an impulsive sequence.
Looking ahead, the analysis suggests that after completing the current wave 3, the market is expected to transition to orange wave 4, representing the next higher degree wave. However, the immediate focus remains on the continuation of orange wave 3, which is anticipated to maintain the downward pressure.
A critical component of this analysis is the invalidation level set at 0.88779. This level serves as a vital checkpoint for confirming the current Elliott Wave count. Should the market price surpass this level, it would invalidate the present wave structure, potentially indicating the end of the downward trend or signaling a significant market correction.
Summary: The USDCHF daily chart underscores a strong bearish trend within orange wave 3, following the completion of orange wave 2. The ongoing navy blue wave 3 supports this downward momentum, with the invalidation level at 0.88779 being essential for confirming the trend's continuation.
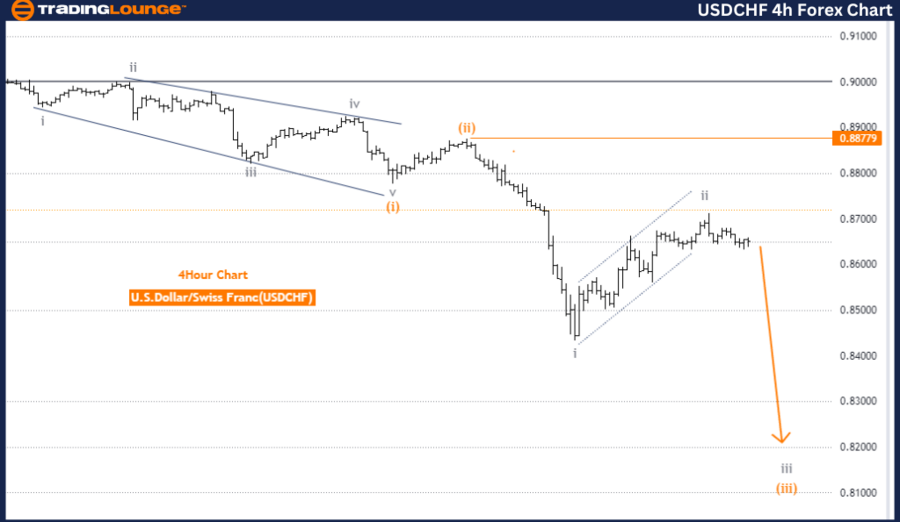
USDCHF Elliott Wave Analysis - Trading Lounge 4-Hour Chart
U.S. Dollar / Swiss Franc (USDCHF) 4-Hour Chart Analysis
USDCHF Elliott Wave Technical Analysis
Function: Trend
Mode: Impulsive
Structure: Gray wave 3
Position: Orange wave 3
Direction Next Higher Degrees: Gray wave 4
Details: Gray wave 2 appears completed; now, gray wave 3 is in play.
Wave Cancel Invalid Level: 0.88779
The 4-hour chart analysis of USDCHF based on Elliott Wave principles reveals a pronounced downtrend, with gray wave 3 reflecting an impulsive movement. This wave signals robust bearish activity in the market. The current phase is marked by orange wave 3, a significant stage in the Elliott Wave sequence, indicating the likely continuation of the downward trend.
Previously, gray wave 2, a corrective phase, was completed, paving the way for gray wave 3. This wave is now in progress, driving prices downward. Gray wave 3 is typically the most extended and powerful wave in an impulsive sequence, suggesting that the bearish momentum is expected to persist.
Following the completion of gray wave 3, the market is projected to enter gray wave 4, which may act as a corrective wave, potentially pausing the downward trend before the final wave in the sequence.
A crucial aspect of this analysis is the wave cancellation invalid level, set at 0.88779. This level is instrumental in validating the current Elliott Wave count. If the market surpasses this level, it would invalidate the present wave structure, indicating that the anticipated downward trend might not continue and could lead to a reversal or a significant correction.
Summary: The USDCHF 4-hour chart analysis indicates a strong downtrend within gray wave 3, following the completion of gray wave 2. The ongoing orange wave 3 reinforces the bearish momentum, with the invalidation level at 0.88779 being key to confirming the trend's continuation.
Technical Analyst: Malik Awais
Source: visit Tradinglounge.com and learn From the Experts Join TradingLounge Here
Previous: EURUSD Elliott Wave Technical Analysis
Special Trial Offer - 0.76 Cents a Day for 3 Months! Click here
Access 7 Analysts Over 170 Markets Covered. Chat Room With Support