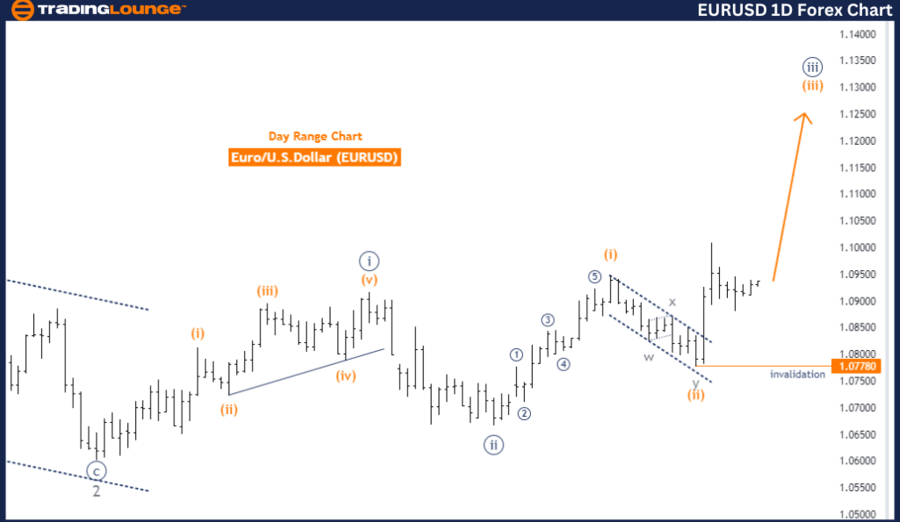
EURUSD Elliott Wave Analysis – Trading Lounge Day Chart
Euro/U.S. Dollar (EURUSD) Day Chart Analysis
EURUSD Elliott Wave Technical Analysis
Function: Trend
Mode: Impulsive
Structure: Orange Wave 3
Position: Navy Blue Wave 3
Direction Next Lower Degrees: Orange Wave 4
Details: Orange Wave 2 appears complete; Orange Wave 3 is currently in progress.
Wave Cancel Invalid Level: 1.07780
The EURUSD Elliott Wave Analysis on the daily chart indicates that the market is currently exhibiting an impulsive trend mode. This analysis primarily focuses on the development of Orange Wave 3, which is part of a larger Navy Blue Wave 3. This wave structure suggests a strong upward momentum in the EURUSD market.
Prior to the current phase, Orange Wave 2, a corrective wave, appears to have concluded. Following this, Orange Wave 3 has initiated and is actively unfolding. The transition from the corrective Wave 2 to the impulsive Wave 3 signals a continuation of the broader upward trend. The progress within Orange Wave 3 indicates ongoing bullish activity.
As the market progresses through Orange Wave 3, the next anticipated phase is Orange Wave 4, a lower-degree wave that is likely to introduce a corrective movement. However, the current focus remains on the upward trajectory of Orange Wave 3, expected to continue driving the market higher.
A critical level to monitor is the Wave Cancel Invalid Level at 1.07780. This level acts as a threshold for the validity of the current Elliott Wave count. If the market falls below this level, the current wave analysis would be invalidated, indicating that the anticipated upward movement within Orange Wave 3 may not proceed as expected. This invalidation point is crucial for traders, as it could signal a potential shift in market direction.
In summary, the EURUSD Elliott Wave Analysis on the daily chart highlights an ongoing impulsive upward trend within Orange Wave 3 following the completion of Orange Wave 2. The market is currently focused on this upward phase, with the invalidation level at 1.07780 serving as a key point to determine the continued validity of this wave structure.\
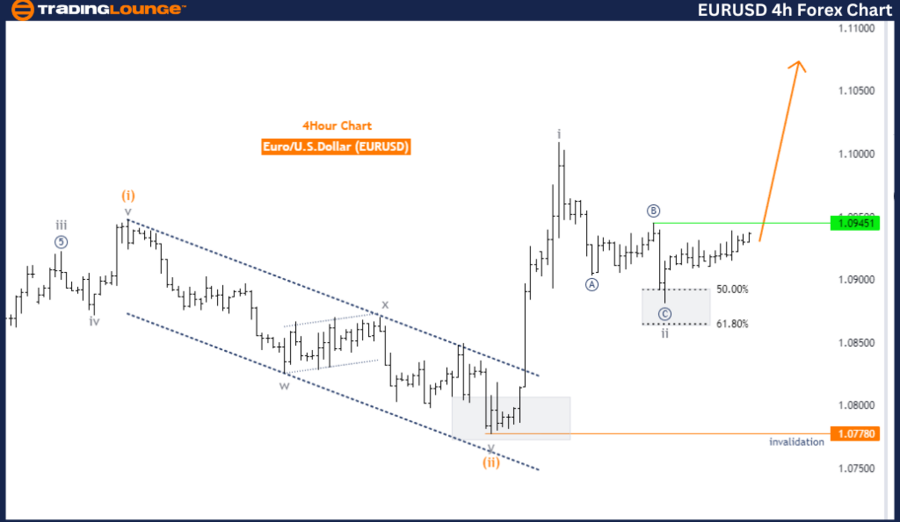
EURUSD Elliott Wave Analysis – Trading Lounge 4-Hour Chart
Euro/U.S. Dollar (EURUSD) 4-Hour Chart Analysis
EURUSD Elliott Wave Technical Analysis
Function: Trend
Mode: Impulsive
Structure: Gray Wave 3
Position: Orange Wave 3
Direction Next Lower Degrees: Gray Wave 4
Details: Gray Wave 2 appears complete; Gray Wave 3 is currently in progress.
Wave Cancel Invalid Level: 1.07780
The EURUSD Elliott Wave Analysis on the 4-hour chart shows that the market is currently in an impulsive trend mode. This analysis focuses on Gray Wave 3, which represents the ongoing upward movement within the market. Gray Wave 3 is part of a broader impulsive wave sequence, indicating strong upward momentum.
According to the analysis, Gray Wave 2, the preceding corrective wave, seems to have completed. The conclusion of Gray Wave 2 marks the end of the corrective phase and the beginning of Gray Wave 3, where the market is expected to continue moving upward with increased strength. The current focus is on the progression of Gray Wave 3, which is actively unfolding.
The next lower-degree direction is identified as Gray Wave 4, suggesting that after Gray Wave 3 reaches its peak, the market might enter another corrective phase before potentially resuming the upward trend. For now, Gray Wave 3 remains the dominant wave within the current market structure, driving the trend.
The Wave Cancel Invalid Level is set at 1.07780, serving as a crucial threshold for the validity of the current Elliott Wave count. If the market drops below this level, it would invalidate the current wave analysis, indicating that the anticipated continuation of the upward movement within Gray Wave 3 might not occur as predicted. In such a scenario, the wave structure and overall market outlook would require reassessment.
In summary, the EURUSD Elliott Wave Analysis on the 4-hour chart underscores the ongoing upward trend within Gray Wave 3 following the completion of Gray Wave 2. The analysis highlights the continuation of this trend, with a key invalidation level at 1.07780, as the market is expected to remain in an upward phase while Gray Wave 3 continues to unfold.
Technical Analyst: Malik Awais
Source: visit Tradinglounge.com and learn From the Experts Join TradingLounge Here
Previous: USDJPY Elliott Wave Technical Analysis
Special Trial Offer - 0.76 Cents a Day for 3 Months! Click here
Access 7 Analysts Over 170 Markets Covered. Chat Room With Support