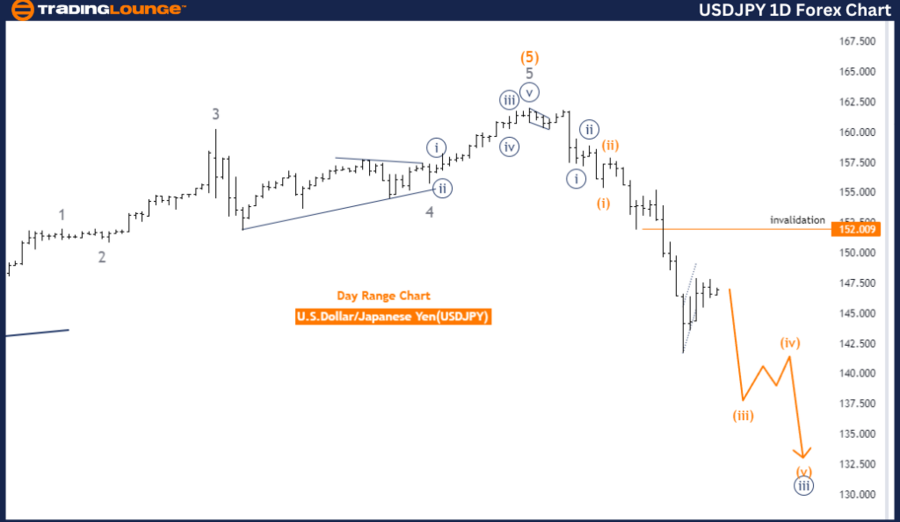
USD/JPY Elliott Wave Analysis: Daily Chart
U.S. Dollar / Japanese Yen (USD/JPY) Daily Chart Analysis
USD/JPY Elliott Wave Technical Analysis
Function: Trend
Mode: Impulsive
Structure: Orange Wave 3
Position: Navy Blue Wave 3
Direction Next Higher Degrees: Orange Wave 4
Details: Orange Wave 2 appears completed, now Orange Wave 3 is active.
Wave Cancel Invalid Level: 152.009
The daily Elliott Wave analysis for USD/JPY highlights a strong trend within an impulsive wave structure, currently driven by Orange Wave 3. This signals an ongoing upward movement under the Elliott Wave framework.
The market's current position within Navy Blue Wave 3, part of the broader Orange Wave 3, indicates sustained upward momentum. Typically, Wave 3 in an impulsive sequence is the most powerful, suggesting that the current trend is likely to continue with significant strength.
The analysis suggests that after the completion of the ongoing Orange Wave 3, the market may transition into Orange Wave 4, a corrective phase. However, the immediate focus remains on the continuation of the upward trend within Orange Wave 3.
With Orange Wave 2 completed, the market has shifted from a corrective phase into the more robust Orange Wave 3. This transition marks the start of a new, stronger phase in the market's upward trajectory.
The critical Wave Cancel Invalid Level is set at 152.009. Falling below this level would invalidate the current wave structure, necessitating a reevaluation of the market's direction. This level is essential for confirming the continuation of the anticipated upward movement within Orange Wave 3.
Summary:
The daily USD/JPY Elliott Wave Analysis indicates a strong bullish trend within an impulsive wave structure. The market is progressing in Navy Blue Wave 3 within Orange Wave 3, following the completion of Orange Wave 2. The 152.009 level is crucial for maintaining this bullish outlook.
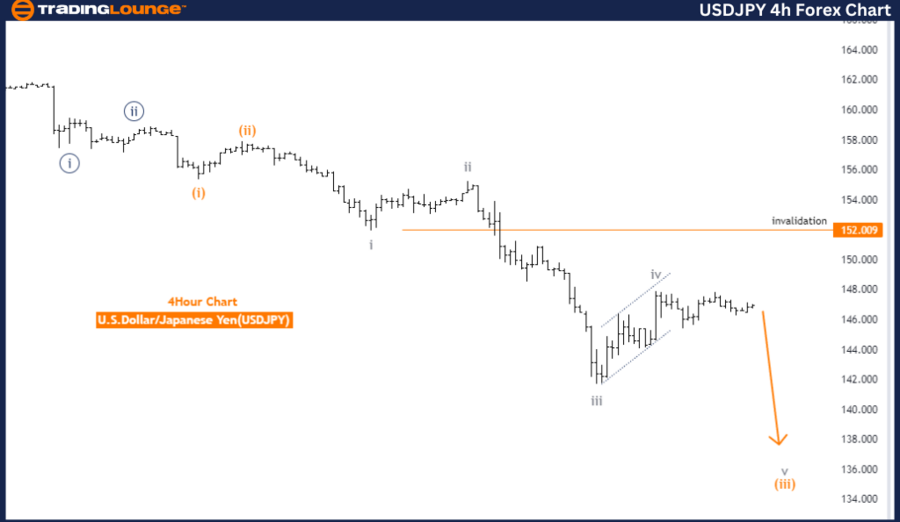
USD/JPY Elliott Wave Analysis: 4-Hour Chart
U.S. Dollar / Japanese Yen (USD/JPY) 4-Hour Chart Analysis
USD/JPY Elliott Wave Technical Analysis
Function: Trend
Mode: Impulsive
Structure: Gray Wave 5
Position: Orange Wave 3
Direction Next Higher Degrees: Orange Wave 4
Details: Gray Wave 4 appears completed; now Gray Wave 5 is active.
Wave Cancel Invalid Level: 152.009
The 4-hour Elliott Wave analysis for USD/JPY suggests a strong upward trend within an impulsive wave mode, led by Gray Wave 5. This indicates that the market is in the final phase of a larger upward movement.
Positioned within Orange Wave 3, the market is advancing in the third wave of Gray Wave 5, often the most powerful and extended wave in an impulsive structure. The direction for higher degrees suggests a potential corrective phase in the form of Orange Wave 4 after the completion of the current wave.
Gray Wave 4's completion has set the stage for Gray Wave 5, marking the final push of the current trend. This progression is expected to maintain its upward momentum until the conclusion of Gray Wave 5.
The Wave Cancel Invalid Level at 152.009 remains crucial for confirming the current wave structure. If the market falls below this level, it would invalidate the present analysis, requiring a reassessment of the market's wave count and direction.
Summary:
The 4-hour USD/JPY Elliott Wave Analysis points to a continued upward trend within an impulsive wave structure. The market is progressing in Orange Wave 3 within Gray Wave 5, following the completion of Gray Wave 4. The 152.009 level is critical to maintaining the validity of this bullish outlook.
Technical Analyst: Malik Awais
Source: visit Tradinglounge.com and learn From the Experts Join TradingLounge Here
Previous: GBPUSD Elliott Wave Technical Analysis