07Mar

CIPLA Elliott Wave Technical Analysis: Stock Forecast, Trend Outlook, Price Target, Support & Resistance for Smarter Trading Decisions

CIPLA – Elliott Wave Technical Analysis (1D Chart)

Function: Counter-Trend (Minor Degree - Grey)

Mode: Corrective

Structure: Impulse within a larger-degree corrective structure

Position: Minor Wave 3 (Grey)

Analysis & Market Positioning

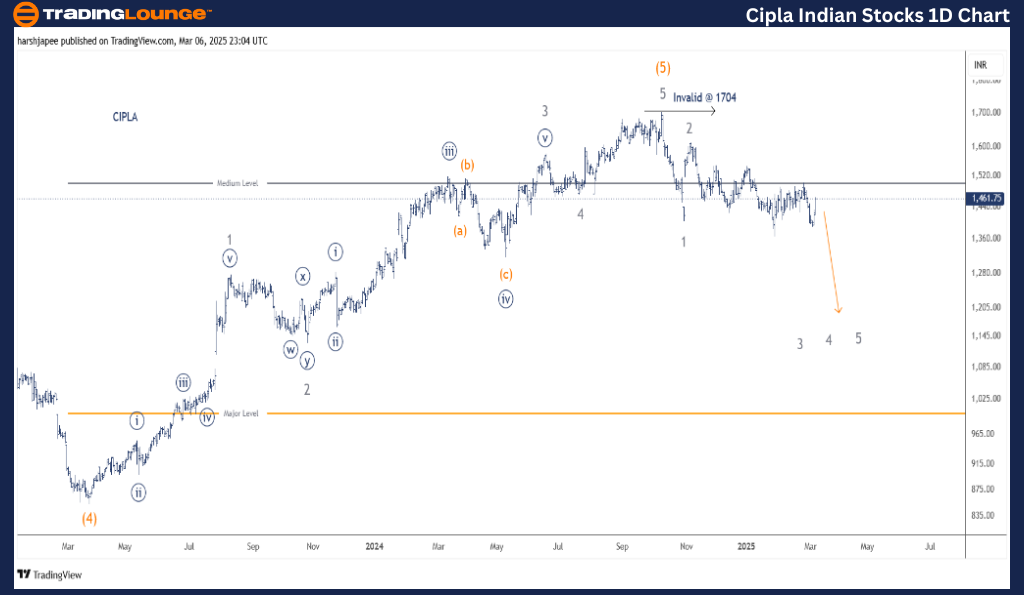
CIPLA's price action suggests a larger-degree correction in progress. Minor Wave 1 concluded near the 1400 level, while Minor Wave 2 appears completed in the 1620-1630 range. Currently, Wave 3 is likely developing downward, targeting a move below the 1600 resistance level, with a key invalidation point at 1705.

CIPLA Daily Chart – Elliott Wave Forecast & Key Levels

The daily chart signals a major peak at 1705, recorded in October 2024, before the stock reversed downward, breaking a key support level at 1470. This decline hints at a potential shift in trend, forming an impulsive structure at Minor Degree.

Historically, the stock dipped to 850 in March 2023, marking Intermediate Wave (4) (Orange) before rallying impulsively to 1750. The subsequent downward momentum indicates that CIPLA may continue lower as Minor Wave 3 progresses.

CIPLA-stock-1d-chart...


CIPLA – Elliott Wave Technical Analysis (4H Chart)

Function: Counter-Trend (Minor Degree - Grey)

Mode: Corrective

Structure: Impulse within a larger-degree corrective structure

Position: Minor Wave 3 (Grey)

Market Dynamics & Wave Progression

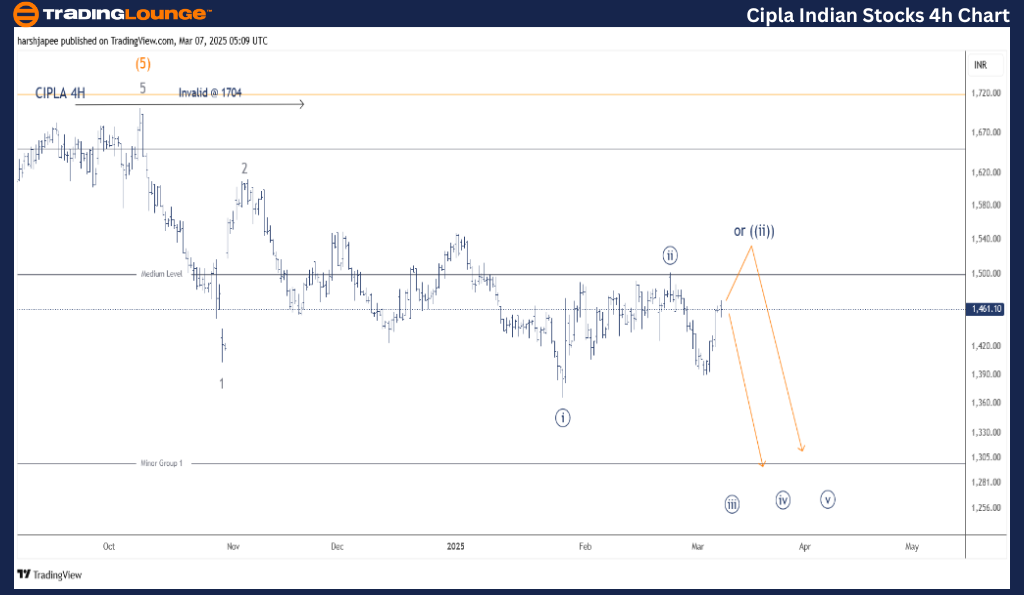
A broader correction remains in play, with Minor Wave 1 completing near 1400 and Minor Wave 2 finalizing around 1620-1630. At present, Wave 3 appears active against the 1705 level, with price action expected to remain below the 1600 resistance.

Additionally, Wave 3 is subdividing into smaller impulsive structures:

  • Minute Wave ((i)) terminated near 1365
  • Minute Wave ((ii)) retraced to 1500
  • Minute Wave ((iii)) is currently unfolding downward

Invalidation Point: 1705

CIPLA 4H Chart – Elliott Wave Forecast & Price Levels

The 4H chart tracks the wave structure following the 1705 high on October 9, 2024. The stock is likely forming an impulsive decline at Minor Degree, with Waves 1 and 2 already completed while Wave 3 extends downward against 1616.

Breakdown of Minor Wave 3 Subdivision:

  • Minute Wave (i): Completed around 1375
  • Minute Wave ((ii)): Completed around 1500 (with an alternative scenario near 1540)
  • Minute Wave ((iii)) is in progress, targeting levels below 1616

Technical Analyst: Harsh Japee

Source: visit Tradinglounge.com and learn From the Experts Join TradingLounge Here 

Previous:BRITANNIA INDUSTRIES Elliott Wave Technical Analysis

VALUE Offer - Buy 1 Month & Get 3 Months!Click here

Access 7 Analysts Over 200 Markets Covered. Chat Room With Support

CIPLA-stock-4h-chart...


Conclusion & Market Outlook

CIPLA is currently in a downtrend within Minute Wave ((iii)) of Minor Wave 3, with key resistance at 1616. Traders should monitor wave developments and price action for further confirmations, identifying potential entry or exit opportunities based on this Elliott Wave structure.

Related

U.S.Dollar /Canadian Dollar Forex Elliott Wave Technical Analysis: Comprehensive  analysis of the USD/CAD currency pair

U.S.Dollar /Canadian Dollar Forex Elliott Wave Technical Analysis: Comprehensive analysis of the USD/CAD currency pair

This comprehensive guide provides an Elliott Wave analysis of the USD/CAD currency pair, offering in...

Read More >
SP500 & NASDAQ: AAPL, AMZN, NVDA, META, NFLX, GOOGL, MSFT, TSLA, Bitcoin. Elliott Wave Analysis

SP500 & NASDAQ: AAPL, AMZN, NVDA, META, NFLX, GOOGL, MSFT, TSLA, Bitcoin. Elliott Wave Analysis

Elliott Wave analysis suggests a downward move for NASDAQ tech stocks until midweek, with TSLA, GOOG...

Read More >
Dogecoin Price News Today: DOGEUSD Elliott Wave Technical Analysis and Crypto Dogecoin and U.S. Dollar Pair

Dogecoin Price News Today: DOGEUSD Elliott Wave Technical Analysis and Crypto Dogecoin and U.S. Dollar Pair

This detailed analysis of Dogecoin (DOGE) focuses on Elliott Wave patterns, price trends, and tradin...

Read More >
Provides a Diversified Portfolio in the Uranium industry With GX URA ETF Commodity Elliott Wave Technical Analysis

Provides a Diversified Portfolio in the Uranium industry With GX URA ETF Commodity Elliott Wave Technical Analysis

The GX URA ETF, or Global X Uranium ETF, provides a diversified portfolio in the uranium industry. T...

Read More >
XRP/ U.S. dollar(XRPUSD) Elliott Wave Technical Analysis 29 November 23

XRP/ U.S. dollar(XRPUSD) Elliott Wave Technical Analysis 29 November 23

XRP/ U.S. dollar(XRPUSD) Elliott Wave Technical Analysis dated 29 November 23

Read More >
USDCHF Elliott Wave Forecast Reveals Bullish Daily Trend and Corrective 4-Hour Phase with Key Invalidation Level at 0.84823

USDCHF Elliott Wave Forecast Reveals Bullish Daily Trend and Corrective 4-Hour Phase with Key Invalidation Level at 0.84823

This analysis presents a clear Elliott Wave breakdown of USDCHF using daily and 4-hour charts, highl...

Read More >

$1 for 2 Weeks

then $29 a month!

What a Special Offer!

Trade Recommendations

Unleash the power of deversified trading with our comprehensive portfolio, covering 250+ markets:

  • Stock Trades
  • Crypto Trades
  • Forex Trades
  • Commodity Trades
Elliott Wave Analysis

Gain a competitive edge with expert insights and AI-powered Elliott Wave charting into:

  • Global Indices
  • US Stocks & ASX Stocks
  • Forex & Crypto
  • Commodities
Top-Notch Trading Tools

Equip yourself with the tools of success:

  • Real-time Chat rooms
  • Elliott Wave Algorithm
  • Portfolio tools
  • TradingLevels
  • Screener
  • Trading Game
7 Elliott Wave Analysts

Stay ahead of the market with daily charts and insightful videos
Your secret to strategic trading!

JOIN HERE


Welcome to TradingLounge (ASIC A.R.No. 321187), specialists in trades, trading education and technical analysis, covering stocks, indices, commodities, forex and cryptocurrencies.

When you join TradingLounge you have access to everything we offer, including trade tools, educational content and a social platform to chat with like-minded investors.

Read more

@Copyright 2024 by tradinglounge.com

Contact Us

Australian no: 02 4787 6020

International no: +61 (2) 47876020

Pay with:

Find us on