Shanghai Composite Elliott Wave Analysis Trading Lounge Day Chart
Function: Bullish Trend
Mode: Impulsive
Structure: Orange Wave 3
Position: Navy Blue Wave 3
Direction Next Higher Degrees: Orange Wave 3 (In Progress)
Details: Completion of orange wave 2, orange wave 3 underway.
Wave Cancel Invalid Level: 2684.5610
Analysis Overview
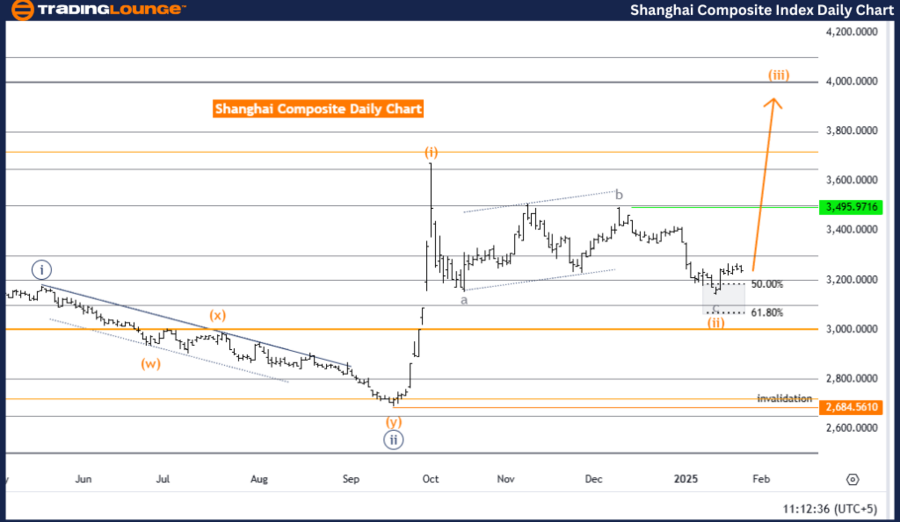
The Shanghai Composite daily chart analysis indicates a strong bullish trend, guided by Elliott Wave principles. The market currently operates in an impulsive mode, signifying upward momentum. The ongoing wave pattern, recognized as orange wave 3, marks a critical phase within the broader uptrend, suggesting continued price growth.
The position within the wave sequence, identified as navy blue wave 3, further reinforces the bullish sentiment, highlighting the market's potential for further expansion. The successful completion of orange wave 2 transitions the market into the next growth stage, forming a solid foundation for further price gains.
The higher-degree trend direction continues to align with a bullish trajectory, supporting long-term growth prospects.
Key Invalidation Level
The invalidation level, set at 2684.5610, acts as a significant reference point for market positioning. A decline below this threshold will invalidate the current wave count, necessitating a reevaluation of the outlook. However, as long as the price holds above this level, the bullish trend remains intact.
Conclusion
To summarize, the Shanghai Composite daily chart analysis presents a bullish market outlook, fueled by the development of orange wave 3 within the larger navy blue wave 3 framework. The completion of orange wave 2 has paved the way for continued growth. The invalidation level of 2684.5610 remains crucial for confirming the current trend structure. As long as the market maintains this level, further upward momentum is expected.
Shanghai Composite Elliott Wave Analysis Trading Lounge Weekly Chart
Shanghai Composite Elliott Wave Technical Analysis
Function: Bullish Trend
Mode: Impulsive
Structure: Orange Wave 3
Position: Navy Blue Wave 3
Direction Next Higher Degrees: Orange Wave 3 (In Progress)
Details: Completion of orange wave 2, orange wave 3 underway.
Wave Cancel Invalid Level: 2684.5610
Analysis Overview
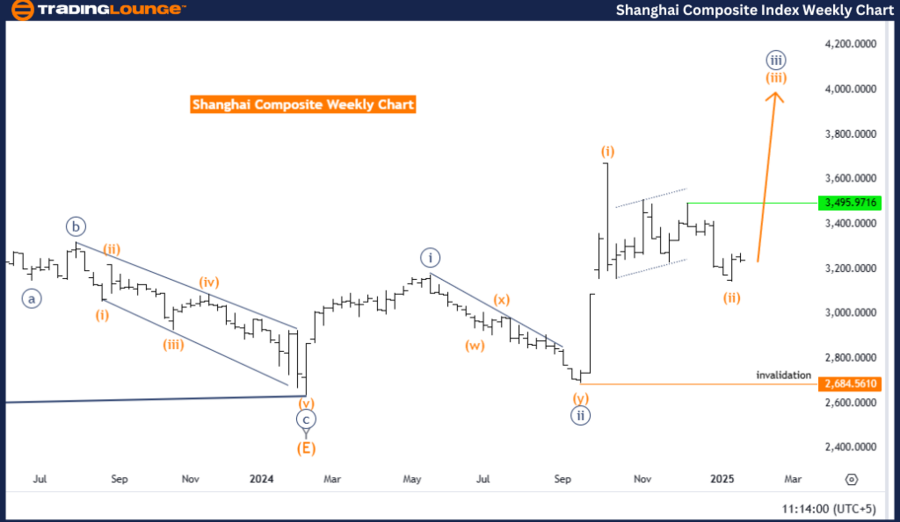
The Shanghai Composite weekly chart analysis confirms a persistent bullish trend, based on Elliott Wave theory. The market remains in an impulsive mode, reflecting continued upward strength. The current wave pattern, orange wave 3, plays an essential role in driving the broader bullish movement, demonstrating sustained market resilience.
Within the wave cycle, the position identified as navy blue wave 3 indicates a crucial phase in the broader bullish trend's expansion. The ongoing formation of orange wave 3 within this structure reinforces the market's upward direction and supports further potential growth.
Following the completion of orange wave 2, the market has now entered the next upward phase, further aligning with the higher-degree wave trend and suggesting continued price advances.
Key Invalidation Level
An important invalidation level of 2684.5610 serves as a reference for the bullish scenario. Should the market drop below this point, the existing wave count will require reassessment. Until then, the bullish wave structure remains valid and points toward further gains.
Technical Analyst: Malik Awais
Source: visit Tradinglounge.com and learn From the Experts Join TradingLounge Here
Previous: DOW JONES - DJI Elliott Wave Technical Analysis
VALUE Offer - Buy 1 Month & Get 3 Months!Click here
Access 7 Analysts Over 200 Markets Covered. Chat Room With Support
Conclusion
In conclusion, the Shanghai Composite weekly chart analysis reflects a strong bullish trend supported by the development of orange wave 3 within the larger navy blue wave 3 framework. The market's transition from orange wave 2 to orange wave 3 signals continued bullish potential. As long as the price holds above the key level of 2684.5610, further upward movement is anticipated, reinforcing the market's strength.