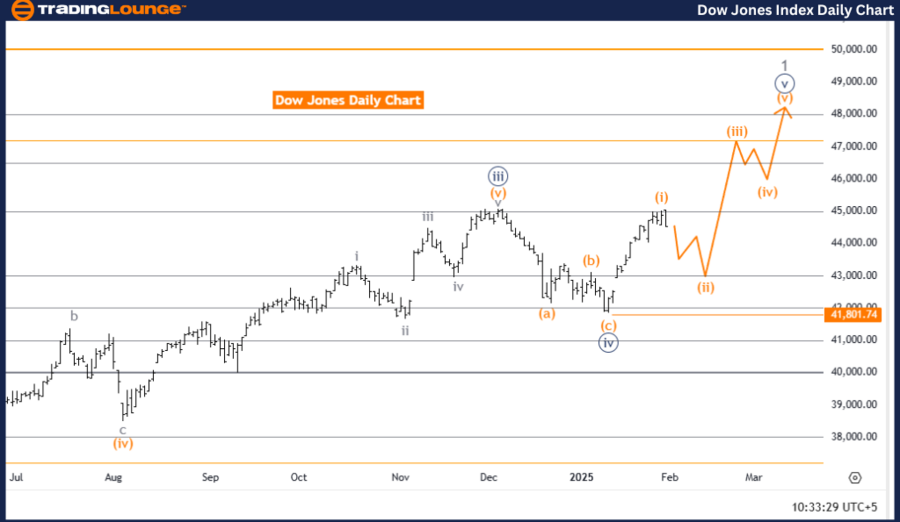
Dow Jones (DJI) Elliott Wave Analysis – Trading Lounge Day Chart
DOW JONES (DJI) Elliott Wave Technical Analysis
Function: Counter Trend
Mode: Impulsive
Structure: Orange Wave 2
Position: Navy Blue Wave 5
Next Higher Degree Direction: Orange Wave 3
Details: Orange wave 1 has completed, and orange wave 2 is currently forming.
Wave Cancellation Invalidation Level: 41822.74
Analysis Overview
This Elliott Wave analysis of the Dow Jones Industrial Average (DJI) daily chart highlights a corrective counter-trend phase within an impulsive wave structure. The primary focus is orange wave 2, which follows the completion of orange wave 1. This phase signals a retracement within the broader bullish market trend.
Currently, the market is within navy blue wave 5, marking the final stage of this wave cycle. The transition from orange wave 1 to orange wave 2 suggests a temporary pullback before an anticipated continuation of the uptrend in orange wave 3. Traders should closely track orange wave 2, as it sets the foundation for the next bullish wave movement.
Future Market Outlook
The wave cancellation invalidation level is set at 41822.74. If the price surpasses this level, the current wave count becomes invalid, requiring a reassessment of market expectations.
Conclusion
This Dow Jones daily chart analysis identifies a corrective phase within navy blue wave 5, driven by orange wave 2. The completion of orange wave 1 confirms the onset of a retracement, which plays a crucial role in shaping future price movements.
The expected shift to orange wave 3 signals a potential resurgence in bullish momentum once the correction ends. Traders should stay vigilant, tracking key price levels and utilizing the wave cancellation invalidation level as a reference for adjusting their market strategies. This analysis offers valuable insights for managing the current market pullback while preparing for potential future rallies.
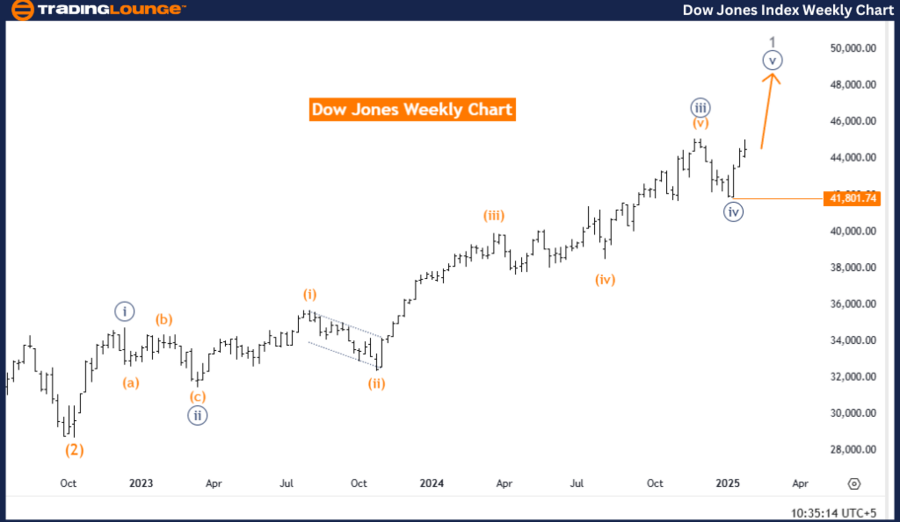
Dow Jones (DJI) Elliott Wave Analysis – Trading Lounge Weekly Chart
DOW JONES (DJI) Elliott Wave Technical Analysis
Function: Bullish Trend
Mode: Impulsive
Structure: Navy Blue Wave 5
Position: Gray Wave 1
Next Higher Degree Direction: Navy Blue Wave 5 (Ongoing)
Details: Navy Blue Wave 4 has concluded, and Navy Blue Wave 5 is now unfolding.
Wave Cancellation Invalidation Level: 41822.74
Analysis Overview
This Elliott Wave analysis of the Dow Jones Industrial Average (DJI) weekly chart emphasizes a strong bullish trend within an impulsive wave structure. The focus is on navy blue wave 5, which commenced after the completion of navy blue wave 4. This signals continued upward momentum, indicating a bullish market phase.
At present, the market is in gray wave 1, marking the early stage of a fresh bullish cycle. The transition from navy blue wave 4 to navy blue wave 5 confirms the market's readiness to sustain an upward trajectory. As navy blue wave 5 progresses, traders should anticipate sustained bullish pressure in the near term.
Future Market Outlook
The wave cancellation invalidation level is fixed at 41822.74. If the price surpasses this level, it would invalidate the current wave count, requiring a new market outlook assessment.
Conclusion
This Dow Jones weekly chart analysis reinforces the ongoing bullish trend, fueled by the formation of navy blue wave 5. The completion of navy blue wave 4 marks the start of a new impulsive phase, strengthening upward market movement.
The market’s current position in gray wave 1 represents the early phase of a new bullish sequence. Traders should stay attuned to price developments and use the wave cancellation invalidation level as a key reference for validating their trading strategies. This analysis delivers key insights for navigating the continued bullish phase while preparing for future price expansions.
Technical Analyst: Malik Awais
Source: visit Tradinglounge.com and learn From the Experts Join TradingLounge Here
Previous: S&P/TSX 60 Elliott Wave Technical Analysis
VALUE Offer - Buy 1 Month & Get 3 Months!Click here
Access 7 Analysts Over 200 Markets Covered. Chat Room With Support