08Nov

Bharat Electronics Stocks technical insights, price targets, and potential trend movements: BEL Elliott Wave Technical Analysis

BHARAT ELECTRONICS – BEL Elliott Wave Analysis (1D Chart)

BEL Elliott Wave Technical Analysis 

Trend Analysis: Intermediate Degree Trend Moving Higher (Orange)

Market Mode: Motive Structure

Wave Structure: Impulse Formation

Current Wave Position: Minute Wave ((ii)) in Navy

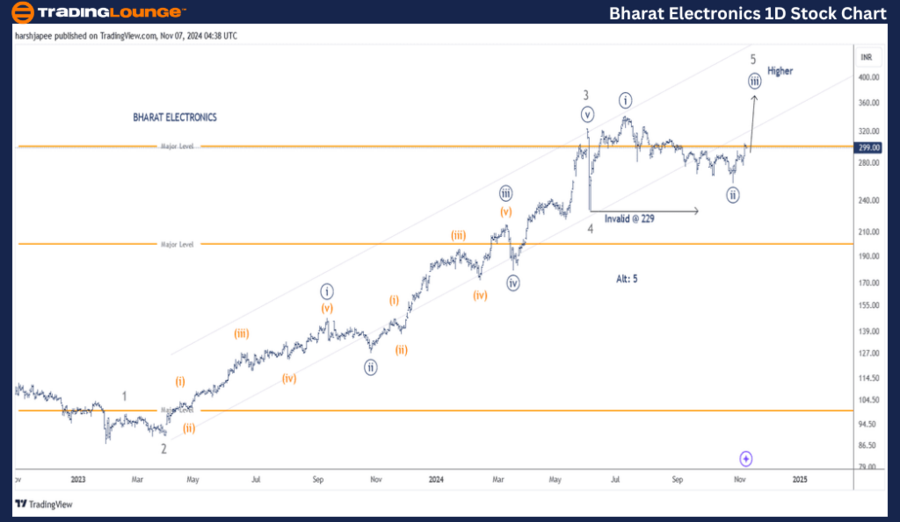
Technical Insights: Minute Wave ((iii)) in Navy within Minor Wave 5 in Grey is advancing higher, holding above the 229 level, with Wave ((ii)) potentially positioned near the 250-60 range. Alternatively, Minor Wave 5 in Grey may have concluded above the 342 mark.

Key Invalidation Level: 229

BHARAT ELECTRONICS Daily Chart Analysis and Potential Elliott Wave Counts

The daily chart analysis of Bharat Electronics indicates a bullish trend as long as prices remain above the 229 support. The stock is advancing towards a potential Minor Wave 5 Grey peak, targeting the 350-70 price range as Minute Wave ((iii)) takes shape.

Following a significant drop to a low of 87 in January 2023, suggesting a potential Intermediate Wave (4), the stock has shown a strong recovery. This upward move divides into Minor Waves 1 to 4, which appears to have completed around the 229 support. If correct, the price is now advancing with Minor Wave 5 unfolding higher.

BHARAT-ELECTRONICS-1...


BHARAT ELECTRONICS – BEL (4H Chart) Elliott Wave Technical Analysis

Trend Analysis: Intermediate Degree Trend Moving Higher (Orange)

Market Mode: Motive Structure

Wave Structure: Impulse Formation

Current Wave Position: Minute Wave ((ii)) in Navy

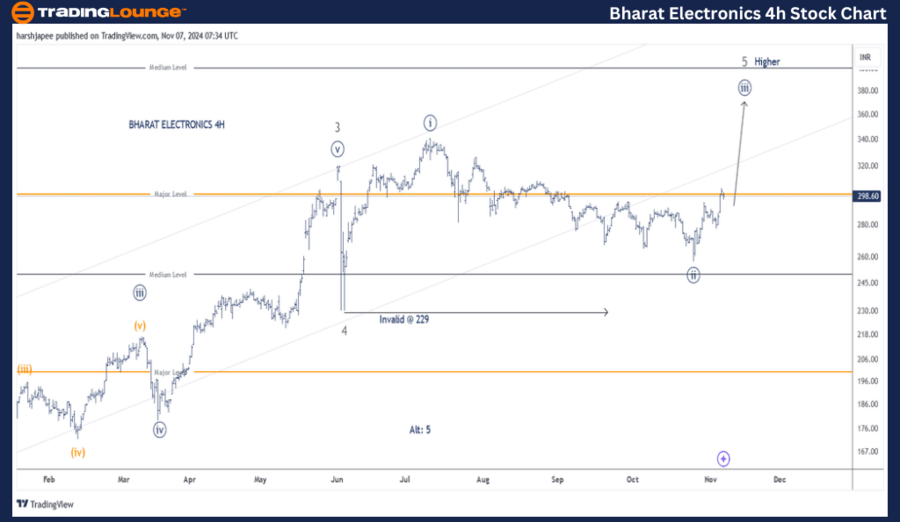
Technical Insights: Minute Wave ((iii)) in Navy within Minor Wave 5 in Grey is advancing higher above the 229 mark, suggesting Wave ((ii)) may have been set around the 250-60 levels. Alternatively, Minor Wave 5 in Grey might have completed above 342. A drop below the 229 mark would invalidate the bullish outlook.

Key Invalidation Level: 229

BHARAT ELECTRONICS 4H Chart Analysis and Potential Elliott Wave Counts

The 4H chart for Bharat Electronics illustrates the minor sub-waves following the completion of Minor Wave 3 near the 325 level. After a sharp correction with Wave 4 ending around 229 on June 03, 2024, Minor Wave 5 is now progressing. Minute Waves ((i)) and ((ii)) appear completed near 342 and 260, respectively. If correct, Minute Wave ((iii)) is likely underway. For the bullish momentum to persist, prices must hold above the 229 level.

Technical Analyst: Harsh Japee

Source: visit Tradinglounge.com and learn From the Experts Join TradingLounge Here 

Previous: ITC Ltd Elliott Wave Technical Analysis

VALUE Offer - Buy 1 Month & Get 3 Months!Click here

Access 7 Analysts Over 200 Markets Covered. Chat Room With Support

BHARAT-ELECTRONICS-4...


Conclusion:

Bharat Electronics appears to be advancing within Minute Wave ((iii)) of Minor Wave 5 in Grey, holding support above 229.

Related

Binance Crypto Price News Today Elliott Wave Technical Analysis for Binance/US Dollar (BNBUSD) - An Insightful Overview

Binance Crypto Price News Today Elliott Wave Technical Analysis for Binance/US Dollar (BNBUSD) - An Insightful Overview

This comprehensive guide offers a detailed Elliott Wave analysis of the Binance/U.S. Dollar (BNBUSD)...

Read More >
Analog Devices Inc.(ADI) Stocks Elliott Wave Technical Analysis: Focusing on the daily and 4-hour charts.

Analog Devices Inc.(ADI) Stocks Elliott Wave Technical Analysis: Focusing on the daily and 4-hour charts.

This article provides an in-depth Elliott Wave analysis of Analog Devices Inc. (ADI), focusing on th...

Read More >
Vanguard Australian Shares Index V300AEQ ETF UNITS – VAS Stock Analysis & Elliott Wave Technical Forecast

Vanguard Australian Shares Index V300AEQ ETF UNITS – VAS Stock Analysis & Elliott Wave Technical Forecast

This article provides an in-depth Elliott Wave analysis of ASX: V300AEQ ETF Units – VAS, focusing o...

Read More >
Valuable Forex Trading Insights for Australian Dollar/U.S. Dollar Currency Pair with AUDUSD Elliott Wave Technical Analysis

Valuable Forex Trading Insights for Australian Dollar/U.S. Dollar Currency Pair with AUDUSD Elliott Wave Technical Analysis

Gain valuable insights into the AUDUSD market with our in-depth Elliott Wave Analysis. Learn about t...

Read More >
Achieving ASX Trading Success: AMCOR PLC (AMC) Stock Insights and Elliott Wave Technical Analysis

Achieving ASX Trading Success: AMCOR PLC (AMC) Stock Insights and Elliott Wave Technical Analysis

Get an in-depth analysis of AMCOR PLC (AMC) with Elliott Wave insights, ASX stock forecasts, and tra...

Read More >
 NASDAQ Stock Market Report: AAPL, TSLA, AMZN, NVDA, MSFT, Meta Platforms, NFLX, GOOGL

NASDAQ Stock Market Report: AAPL, TSLA, AMZN, NVDA, MSFT, Meta Platforms, NFLX, GOOGL

NASDAQ-listed stocks, including AAPL, TSLA, AMZN, NVDA, MSFT, Meta Platforms, NFLX, and GOOGL. The a...

Read More >

Buy 1 Month

Get 3 Months!

Special Offer:

Trade Recommendations

Unleash the power of deversified trading with our comprehensive portfolio, covering:

  • Stock Trades
  • Crypto Trades
  • Forex Trades
  • Commodity Trades
Elliott Wave Analysis

Gain a competive edge with expert insights in to:

  • Global Indices
  • US Stocks & ASX Stocks
  • Forex & Crypto
  • Commodities
Top-Notch Trading Tools

Equip yourself with the tools of success:

  • Social Chat
  • Elliott Wave Algorithm
  • Screener
  • TradingLevels
  • Trading Game
7 Elliott Wave Analysts

Stay ahead of the market with daily charts and insightful videos
-Your secret to strategic trading!

JOIN HERE


Welcome to TradingLounge (ASIC A.R.No. 321187), specialists in trades, trading education and technical analysis, covering stocks, indices, commodities, forex and cryptocurrencies.

When you join TradingLounge you have access to everything we offer, including trade tools, educational content and a social platform to chat with like-minded investors.

Read more

@Copyright 2024 by tradinglounge.com

Contact Us

Australian no: 02 4787 6020

International no: +61 (2) 47876020

Pay with:

Find us on