ITC Ltd – ITC Elliott Wave Analysis TradingLounge (1D Chart)

ITC Elliott Wave Technical Analysis

Function: Counter Trend (Minor degree, Grey)

Mode: Corrective

Structure: Impulse within a larger corrective wave

Position: Lower degree impulse may have been completed but remains unlabeled.

Details: Last week, ITC confirmed a potential trend shift with a break below the 480 level. This suggests that a lower (Minute) degree impulse wave might be complete, although it is not labelled yet. Alternate counts will be considered if price action supports it.

Invalidation Point: 530

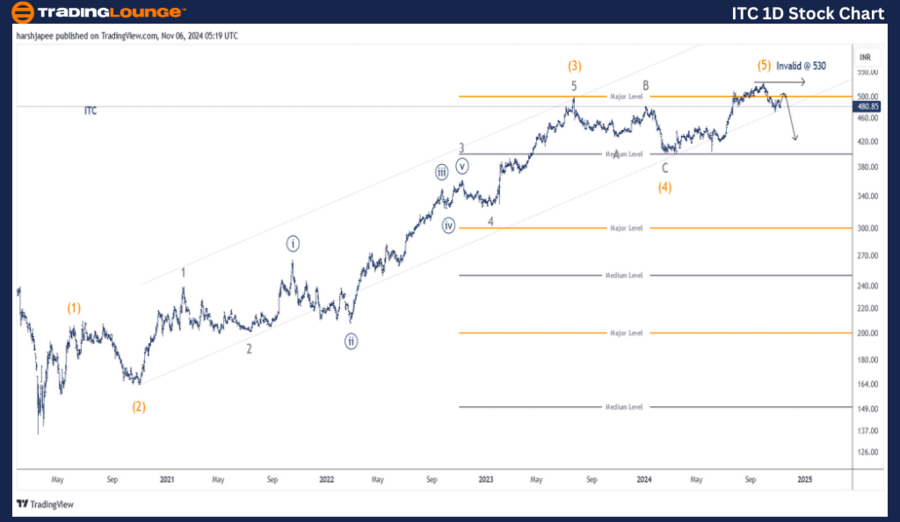
ITC Daily Chart Technical Analysis and Potential Elliott Wave Counts:

The daily chart for ITC signals a possible end of Intermediate Wave (5) Orange at the 530 high. If this scenario is accurate, a corrective wave may have started, with recent price action dropping below the 400 level in recent trading sessions. Another possibility is that Minor Wave 4 of (5) has completed near the 470 mark.

Since the stock reached lows around 135 in March 2020, it has experienced a significant rally that peaked at 530, completing an Intermediate-level impulse wave. Notably, Minor Wave 3 within Intermediate Wave (3) was extended.

Following Intermediate Wave (4)’s termination around the 400 mark, the stock rallied to 530, potentially marking the end of Intermediate Wave (5). If this analysis holds, ITC could be entering a larger corrective phase with a downward trend.

ITC-LTD-1D-Stock-Cha...


ITC Ltd – ITC (4H Chart) Elliott Wave Technical Analysis

Function: Counter Trend (Minor degree, Grey)

Mode: Corrective

Structure: Impulse within a larger corrective wave

Position: Lower degree impulse might be complete.

Details: A break below the 480 level last week supports a potential trend shift. This suggests that a lower (Minute) degree impulse wave might be complete, though it remains unlabeled. Alternatively, the recent 530 high could represent Minor Wave 3, followed by Wave 4 around 470. Should this alternate scenario play out, ITC may see a rally that surpasses 530.

Invalidation Point: 530

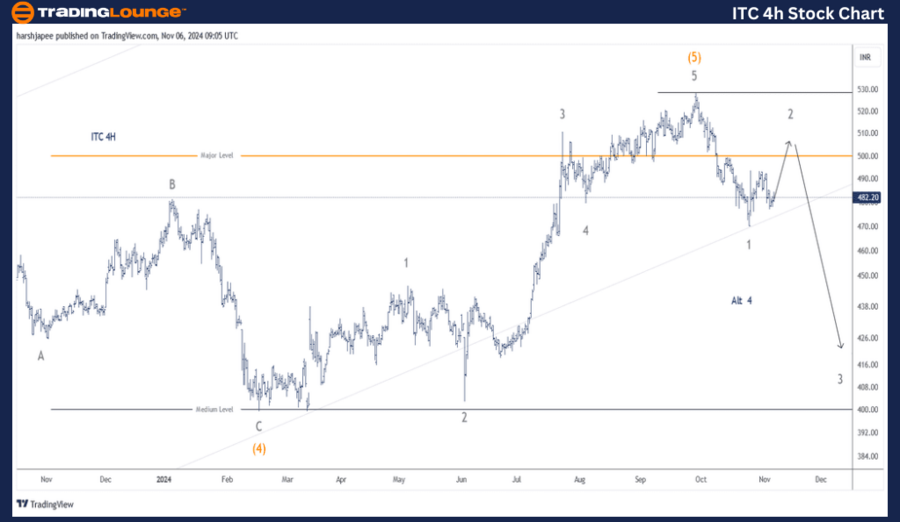
ITC 4H Chart Technical Analysis and Potential Elliott Wave Counts:

The 4-hour chart of ITC shows the development of sub-waves since the termination of Intermediate Wave (4) Orange around the 400-405 mark. Intermediate Wave (5) may be further subdivided into Minor Waves 1 through 5, culminating around the 530 level. Alternatively, Minor Wave 4 could have ended around 470, potentially paving the way for another rally above 530.

Technical Analyst: Harsh Japee

Source: visit Tradinglounge.com and learn From the Experts Join TradingLounge Here 

Previous: COAL INDIA Elliott Wave Technical Analysis

VALUE Offer - Buy 1 Month & Get 3 Months!Click here

Access 7 Analysts Over 200 Markets Covered. Chat Room With Support

ITC-LTD-4h-Stock-Cha...


Conclusion:

ITC might have completed Intermediate Wave (5) Orange around the 530 level, signalling the beginning of a larger corrective wave.

Related

Adani Enterprises Elliott Wave Analysis: Technical Insights, Price Predictions, and Chart Analysis for Informed Trading Decisions

Adani Enterprises Elliott Wave Analysis: Technical Insights, Price Predictions, and Chart Analysis for Informed Trading Decisions

A comprehensive Elliott Wave analysis of Adani Enterprises discovers insights into the stock's c...

Read More >
Elliott Wave Analysis & Nasdaq Tech Stocks Trading Strategies | Trading Lounge

Elliott Wave Analysis & Nasdaq Tech Stocks Trading Strategies | Trading Lounge

Market Outlook Summary: Indices Expectation: The S&P 500 and Nasdaq are anticipated to rise in th...

Read More >
Bitcoin Crypto Price News Today BTCUSD Elliott Wave Technical Analysis: Focusing on BTCUSD Price Movements

Bitcoin Crypto Price News Today BTCUSD Elliott Wave Technical Analysis: Focusing on BTCUSD Price Movements

This article provides an in-depth Bitcoin Elliott Wave analysis, focusing on BTCUSD price movements....

Read More >
KOSPI Composite Elliott Wave Analysis: Market Forecast, Key Support at 2,438.17, Trading Strategy & Price Prediction

KOSPI Composite Elliott Wave Analysis: Market Forecast, Key Support at 2,438.17, Trading Strategy & Price Prediction

The KOSPI Composite Elliott Wave Analysis indicates a bullish trend, with the market currently in Or...

Read More >
Our ASX Wisetech Global Limited Stock Analysis Covers Short-term Movements and Outlooks: WTC Elliott Wave Forecast

Our ASX Wisetech Global Limited Stock Analysis Covers Short-term Movements and Outlooks: WTC Elliott Wave Forecast

Our detailed Elliott Wave analysis for ASX: Wisetech Global Limited (WTC) provides key insights into...

Read More >

$1 for 2 Weeks

then $29 a month!

What a Special Offer!

Trade Recommendations

Unleash the power of deversified trading with our comprehensive portfolio, covering 250+ markets:

  • Stock Trades
  • Crypto Trades
  • Forex Trades
  • Commodity Trades
Elliott Wave Analysis

Gain a competitive edge with expert insights and AI-powered Elliott Wave charting into:

  • Global Indices
  • US Stocks & ASX Stocks
  • Forex & Crypto
  • Commodities
Top-Notch Trading Tools

Equip yourself with the tools of success:

  • Real-time Chat rooms
  • Elliott Wave Algorithm
  • Portfolio tools
  • TradingLevels
  • Screener
  • Trading Game
7 Elliott Wave Analysts

Stay ahead of the market with daily charts and insightful videos
Your secret to strategic trading!

JOIN HERE


Welcome to TradingLounge (ASIC A.R.No. 321187), specialists in trades, trading education and technical analysis, covering stocks, indices, commodities, forex and cryptocurrencies.

When you join TradingLounge you have access to everything we offer, including trade tools, educational content and a social platform to chat with like-minded investors.

Read more

@Copyright 2024 by tradinglounge.com

Contact Us

Australian no: 02 4787 6020

International no: +61 (2) 47876020

Pay with:

Find us on