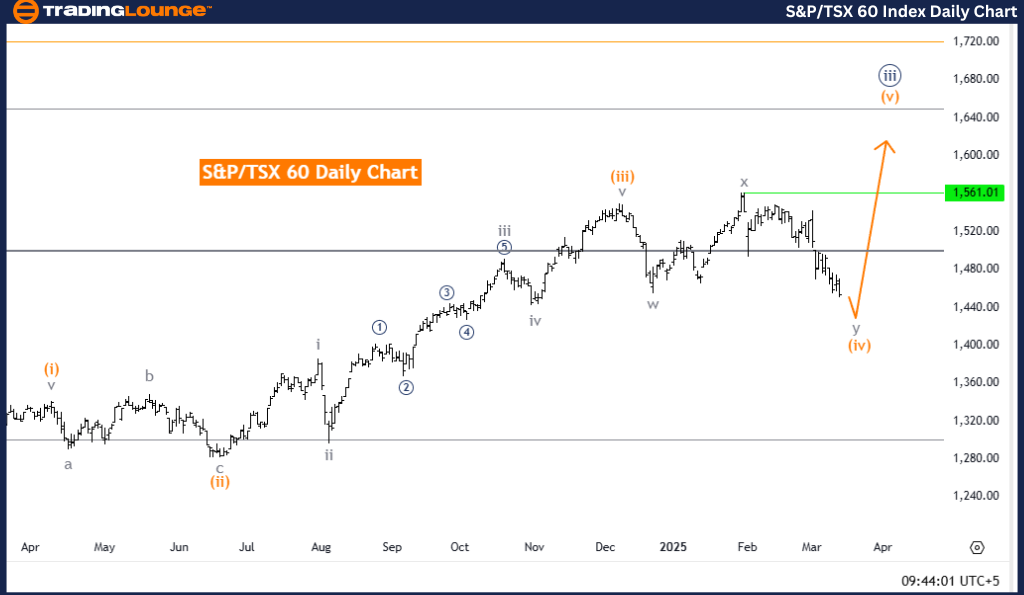
S&P/TSX 60 Elliott Wave Analysis – Trading Lounge Day Chart
S&P/TSX 60 Elliott Wave Technical Analysis
Function: Counter Trend
Mode: Corrective
Structure: Orange Wave 4
Position: Navy Blue Wave 3
Next Higher Degree Direction: Orange Wave 5
Details:
- Orange Wave 3 appears completed.
- Orange Wave 4 is currently unfolding.
Analysis Overview
The S&P/TSX 60 Elliott Wave Analysis for the daily chart provides an in-depth look at the current market trend and possible future movements.
- The market is presently in a counter-trend phase, indicating corrective price action rather than a strong directional move.
- The primary wave under observation is Orange Wave 4, which is part of the larger Navy Blue Wave 3 structure.
- Orange Wave 3 has likely concluded, and the market has transitioned into Orange Wave 4.
- Since Orange Wave 4 is corrective, traders should expect sideways consolidation or retracement movements before the next major trend develops.
Key Considerations for Traders
- The next higher-degree wave to monitor is Orange Wave 5, which will follow after Orange Wave 4 completes.
- Traders should closely observe the development of Orange Wave 4 and prepare for potential trend shifts.
- Understanding the current wave structure enhances forecasting accuracy for future price movements.
- The daily chart analysis offers a broad perspective, enabling traders to align strategies with larger market trends and upcoming turning points.
Trading Insights
This Elliott Wave analysis of the S&P/TSX 60 daily chart offers valuable guidance for traders navigating the current corrective phase.
- Elliott Wave patterns are essential in making informed trading decisions.
- Identifying the completion of one wave and the emergence of another helps traders anticipate market direction and adjust their strategies accordingly.
- Corrective waves often precede major market trends, making it crucial to remain patient and vigilant during these phases.
- By leveraging Elliott Wave principles, traders can gain insights into market behavior, refining their decision-making and risk management approaches.
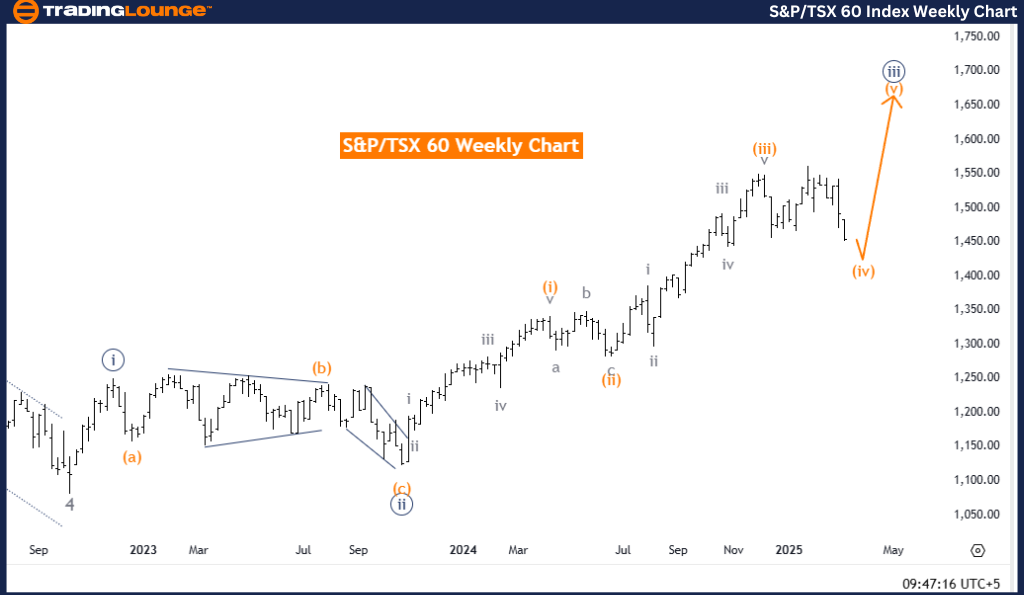
S&P/TSX 60 Elliott Wave Analysis – Trading Lounge Weekly Chart
S&P/TSX 60 Elliott Wave Technical Analysis
Function: Counter Trend
Mode: Corrective
Structure: Orange Wave 4
Position: Navy Blue Wave 3
Next Higher Degree Direction: Orange Wave 5
Details:
- Orange Wave 3 appears completed.
- Orange Wave 4 is currently unfolding.
Analysis Overview
The S&P/TSX 60 Elliott Wave Analysis for the weekly chart provides a broader evaluation of the market’s current trend and future outlook.
- The index is in a counter-trend phase, marked by corrective rather than impulsive movements.
- The key structure under examination is Orange Wave 4, which forms part of the larger corrective sequence within Navy Blue Wave 3.
- Orange Wave 3 has likely ended, signaling the beginning of Orange Wave 4.
- As a corrective wave, Orange Wave 4 may lead to sideways or retracement price action before the next impulse wave takes shape.
Key Considerations for Traders
- The next major wave to track is Orange Wave 5, which will emerge once Orange Wave 4 completes.
- Traders should closely monitor the price behavior within Orange Wave 4 to anticipate the next major movement.
- Understanding the Elliott Wave structure helps traders position themselves ahead of significant market shifts.
- The weekly chart analysis provides long-term insights, helping traders adjust their strategies according to larger market cycles and pivot points.
Trading Insights
This in-depth Elliott Wave analysis of the S&P/TSX 60 weekly chart provides traders with a structured framework for navigating corrective phases and positioning for future trends.
- Wave patterns guide traders in making precise market decisions.
- Recognizing the end of one wave and the start of another aids in forecasting potential price movements.
- Corrective phases often set the stage for major trend developments, highlighting the importance of staying patient and observant.
- Weekly chart analysis offers clarity on broader market movements, allowing traders to plan strategies aligned with long-term Elliott Wave trends.
- Applying Elliott Wave principles enhances market insight, risk management, and decision-making.
Technical Analyst: Malik Awais
Source: Visit Tradinglounge.com and learn from the Experts. Join TradingLounge Here
Previous: DAX (Germany) Elliott Wave Technical Analysis
VALUE Offer - Buy 1 Month & Get 3 Months!Click here
Access 7 Analysts Over 200 Markets Covered. Chat Room With Support