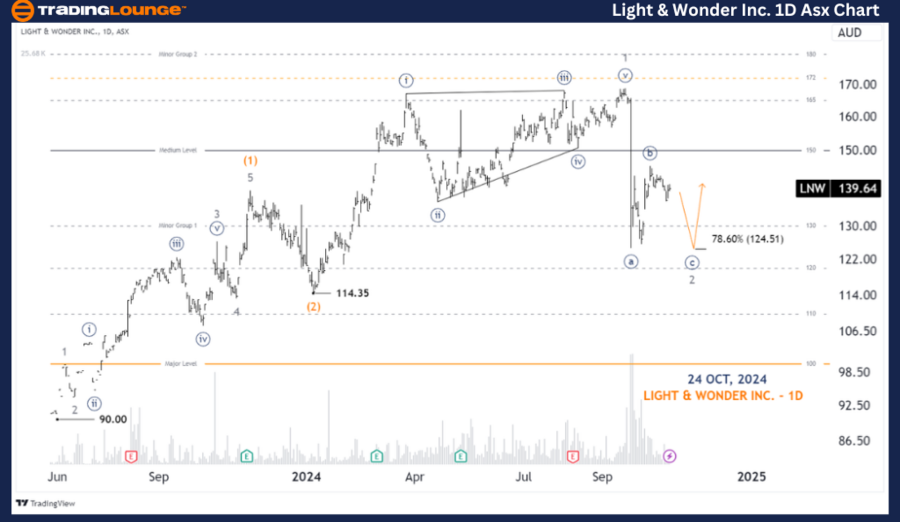
ASX: LIGHT & WONDER INC. – LNW Elliott Wave Analysis 1D Chart
Greetings, today’s Elliott Wave analysis focuses on the Australian Stock Exchange (ASX) LIGHT & WONDER INC. (LNW). Our analysis highlights LNW pushing lower to complete wave 2-grey, with the potential for wave 3-grey to rally much higher afterward.
ASX: LIGHT & WONDER INC. – LNW 1D Chart (Semilog Scale) Analysis
ASX: LIGHT & WONDER INC. – LNW Elliott Wave Technical Analysis
Function: Major Trend (Intermediate degree, orange)
Mode: Motive
Structure: Impulse
Position: Wave 2-grey of Wave (3)-orange
Details: Wave 1-grey has just completed as a Diagonal, and wave 2-grey is currently unfolding, pushing lower. This wave could continue to decline. It's important to note that Diagonal patterns often precede sharp movements and deep corrections.
Invalidation Point: 114.35

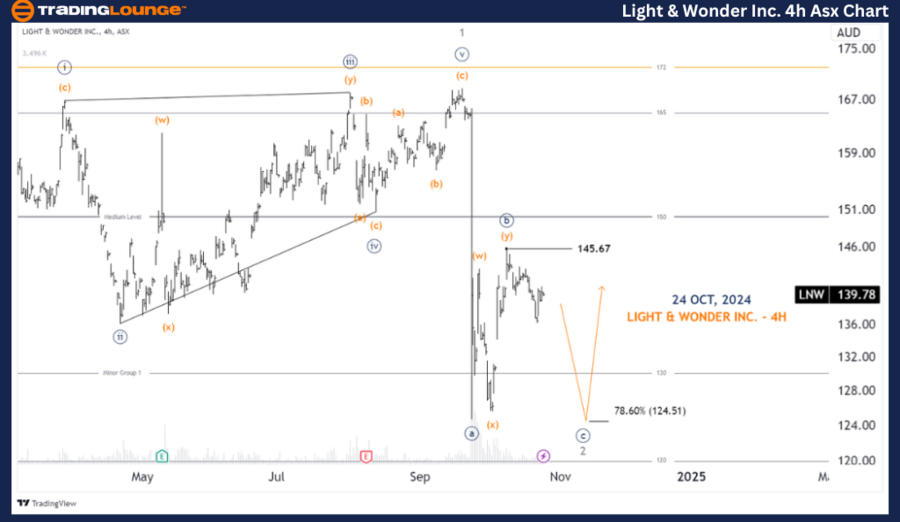
ASX: LIGHT & WONDER INC. – LNW 4-Hour Chart Analysis
Function: Major Trend (Minor degree, grey)
Mode: Motive
Structure: Impulse
Position: Wave ((c))-navy of Wave 2-grey
Details: Since wave 1-grey has ended, wave 2-grey is unfolding as a Zigzag labeled ((a))((b))((c))-navy. Wave ((b))-navy likely concluded at 145.67, and wave ((c))-navy is now pushing lower, targeting the next low around 124.51.
Invalidation Point: 145.67
Technical Analyst: Hua (Shane) Cuong, CEWA-M (Master’s Designation).
Source: visit Tradinglounge.com and learn From the Experts Join TradingLounge Here
See Previous: Northern Star Resources Ltd Elliott Wave Technical Analysis
VALUE Offer - Buy 1 Month & Get 3 Months!Click here
Access 7 Analysts Over 200 Markets Covered. Chat Room With Support

Conclusion:
Our Elliott Wave analysis for ASX: LIGHT & WONDER INC. (LNW) provides a clear forecast of both the immediate and contextual market trends. We aim to help traders identify potential opportunities by offering specific price points that serve as validation or invalidation signals for our wave counts. By combining these insights, we provide a professional and objective perspective on the evolving market trends for LNW.