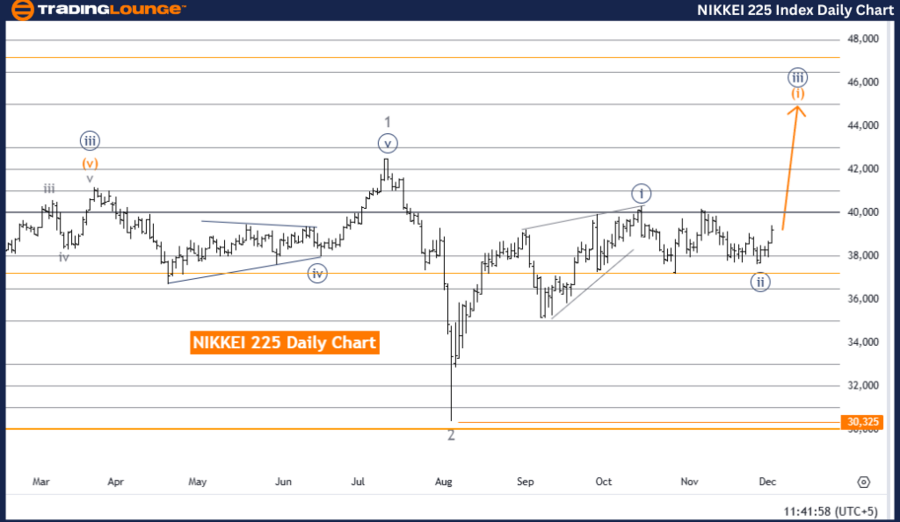
NIKKEI 225 (N225) Elliott Wave Analysis Trading Lounge Day Chart
NIKKEI 225 (N225) Elliott Wave Technical Analysis
Function: Bullish Trend
Mode: Impulsive
Structure: Orange Wave 1
Position: Navy Blue Wave 3
Direction Next Lower Degrees: Orange Wave 2
Details
The NIKKEI 225 daily chart provides an Elliott Wave analysis that indicates a strong bullish trend. The current wave structure is identified as orange wave 1, which forms part of a broader impulsive sequence within navy blue wave 3.
This analysis suggests that navy blue wave 2 has likely concluded, paving the way for orange wave 1 of navy blue wave 3 to advance. Following the principles of Elliott Wave Theory, the repetitive wave patterns predict the continuation of the bullish market trend.
Upon the completion of orange wave 1, the market is expected to transition into orange wave 2, which would align with the ongoing upward momentum.
Key Levels
- Wave Cancel Invalidation Level: 30,325
If the market price falls below this level, the current wave analysis must be reassessed as it would suggest a deviation from the anticipated bullish structure.
Trading Insights
This analysis offers traders a reliable framework to anticipate upward price movements. The impulsive nature of the ongoing wave structure reinforces a bullish outlook, while the outlined key levels provide critical markers to validate or reconsider the wave count.
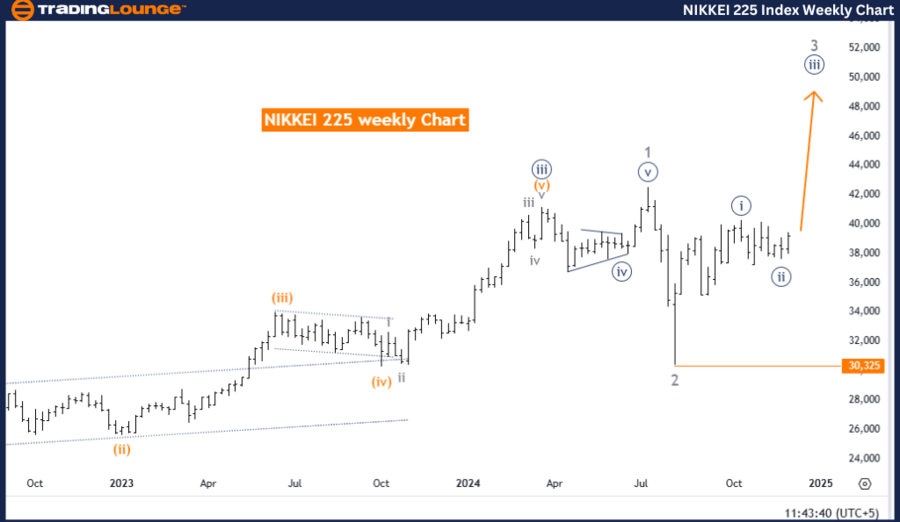
NIKKEI 225 (N225) Elliott Wave Analysis Trading Lounge Weekly Chart
NIKKEI 225 (N225) Elliott Wave Technical Analysis
Function: Bullish Trend
Mode: Impulsive
Structure: Navy Blue Wave 3
Position: Gray Wave 3
Direction Next Lower Degrees: Navy Blue Wave 3 (Started)
Details
The NIKKEI 225 weekly chart also demonstrates an Elliott Wave analysis confirming a bullish trend. The current wave structure is classified as navy blue wave 3, which is part of a larger impulsive sequence within gray wave 3.
Based on the analysis, navy blue wave 2 has likely concluded, signaling the beginning of navy blue wave 3. This marks the start of a robust upward phase, consistent with Elliott Wave Theory, which utilizes cyclical wave patterns to forecast market movements.
The next phase is expected to continue the progression of navy blue wave 3, maintaining alignment with the broader bullish impulsive trend.
Key Levels
- Wave Cancel Invalidation Level: 30,325
A drop below this level would necessitate a reevaluation of the current wave structure as it would indicate a potential departure from the projected bullish outlook.
Trading Insights
The weekly chart analysis provides traders with an in-depth perspective of the market's long-term upward trajectory. It emphasizes the impulsive characteristics of the ongoing wave structure, offering insights into the continuation of bullish momentum. Additionally, it outlines key levels and trends that are essential for making informed trading decisions over the coming weeks.
Technical Analyst: Malik Awais
Source: visit Tradinglounge.com and learn From the Experts Join TradingLounge Here
Previous: DOW JONES (DJI) Elliott Wave Technical Analysis
VALUE Offer - Buy 1 Month & Get 3 Months!Click here
Access 7 Analysts Over 200 Markets Covered. Chat Room With Support