AMZN Elliott Wave Forecast | Trading Lounge Daily Chart
Amazon.com Inc. (AMZN) Daily Chart Analysis
AMZN Elliott Wave Technical Analysis
FUNCTION: Trend
MODE: Impulsive
STRUCTURE: Motive
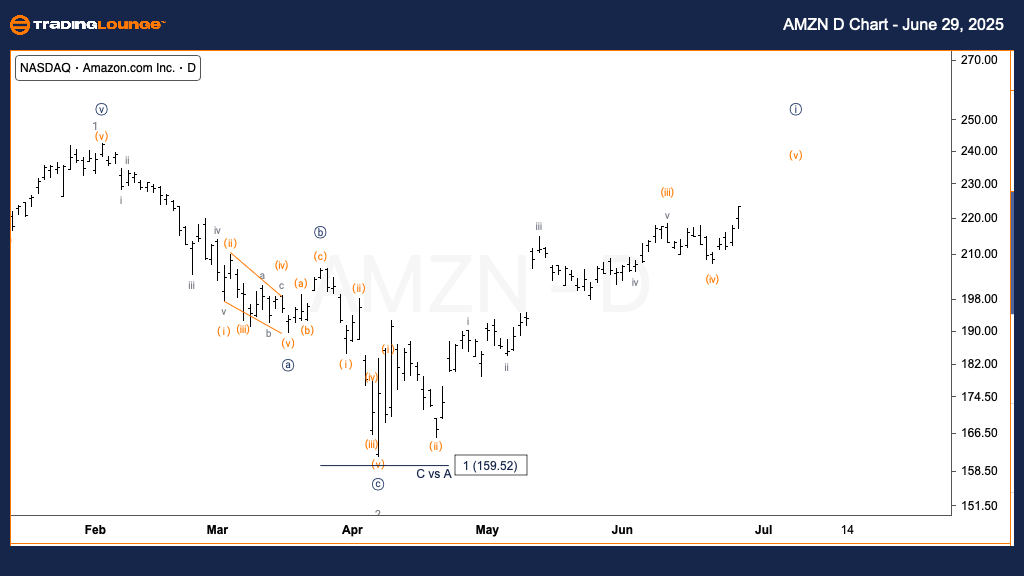
POSITION: Wave (v) of {i}
DIRECTION: Upside continuation in wave (v)
DETAILS: Amazon (AMZN) is advancing through a five-wave Elliott sequence within wave {i}, with wave (v) currently forming. The earlier wave (iii) extended, strengthening the potential for further gains as wave (v) unfolds. This supports the broader bullish trend on the daily timeframe.
Amazon.com Inc. (AMZN) US Stock 1-Hour Chart Analysis
AMZN Elliott Wave Technical Analysis
FUNCTION: Trend
MODE: Impulsive
STRUCTURE: Motive
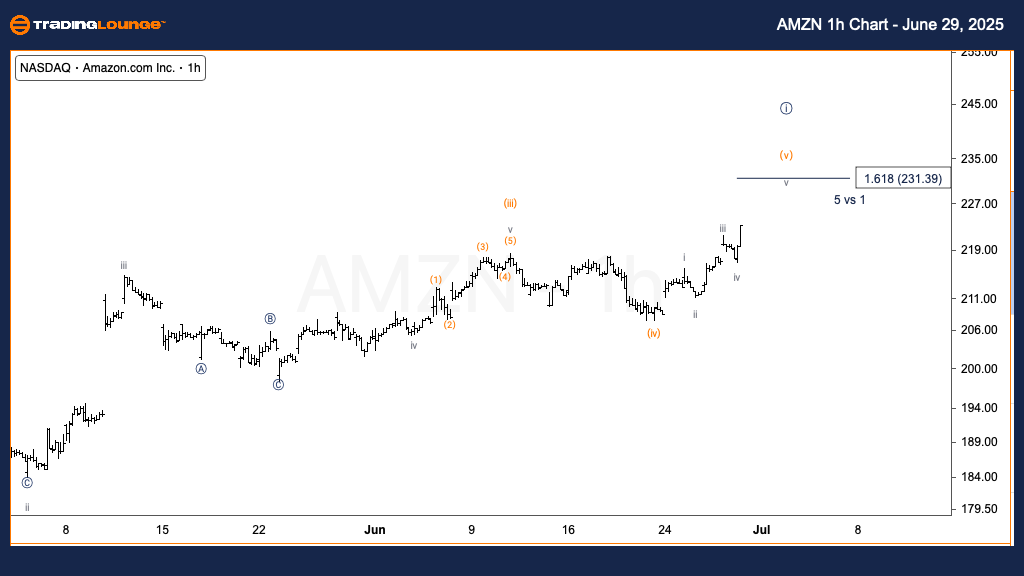
POSITION: Wave (v) of {i}
DIRECTION: Uptrend expected in wave (v)
DETAILS: The wave (v) on the intraday chart is progressing. Since wave iii and wave i of (v) are nearly equal in length, there's a strong possibility that wave v will extend. This could lead AMZN toward the top boundary of Minor Group 1, with an upside target near $230.
Technical Analyst: Alessio Barretta
Source: Visit Tradinglounge.com and learn from the Experts. Join TradingLounge Here
Previous: PayPal Holdings Inc. (PYPL) Elliott Wave Technical Analysis
VALUE Offer - $1 for 2 Weeks then $29 a month!Click here
Access 7 Analysts Over 200 Markets Covered. Chat Room With Support
AMZN Elliott Wave Summary – Daily & 1H Timeframes
This Elliott Wave analysis of Amazon.com Inc. (AMZN) evaluates price action using both daily and 1-hour charts.
Daily Chart Summary:
AMZN continues to progress within wave (v) of {i}, marking the final leg of a motive wave from the April low. With wave (iii) showing an extension, wave (v) may reach a similar length or end as a truncation. Upon completion of wave (v), a corrective wave {ii} may develop, indicating a potential pullback.
1-Hour Chart Summary:
Wave (v) is building with structural clarity. The proportional size of waves iii and i in wave (v) points to a possible extension in wave v. AMZN could reach toward $230, aligning with Fibonacci targets commonly associated with motive wave extensions.