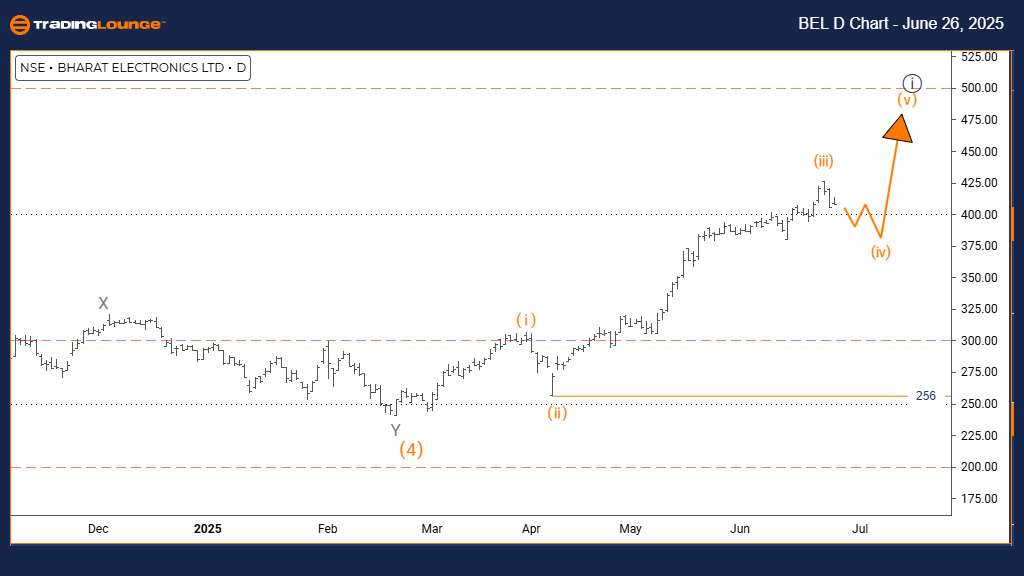
BHARAT ELECTRONICS Elliott Wave Analysis – Trading Lounge Day Chart
BHARAT ELECTRONICS Elliott Wave Technical Review
FUNCTION: Counter Trend
MODE: Corrective
STRUCTURE: Orange Wave 4
POSITION: Navy Blue Wave 1
DIRECTION NEXT HIGHER DEGREES: Orange Wave 5
DETAILS: Orange Wave 3 appears complete, initiating Orange Wave 4.
Wave Cancel/Invalidation Level: 256
The Elliott Wave daily chart analysis for BHARAT ELECTRONICS highlights a corrective phase within a counter-trend pattern. This movement is taking place within Navy Blue Wave 1, indicating a short-term retracement inside a larger bullish structure.
According to the wave analysis, Orange Wave 3 has likely ended, and the stock is currently transitioning into Orange Wave 4, which usually retraces some of the gains made during the previous wave. The next projected movement at a higher degree is Orange Wave 5, which is expected to resume the upward momentum after the current corrective phase ends.
Currently, the market behavior confirms that BHARAT ELECTRONICS is navigating through Orange Wave 4, a typical consolidation phase. Being placed within Navy Blue Wave 1 further supports the presence of a correction within a long-term bullish outlook.
A key price level to monitor is the wave invalidation level at 256. Any move below this level would invalidate the current wave count and require a fresh technical review. As long as the price remains above this threshold, the corrective structure and the potential for a bullish continuation stay valid.
Investors and traders should watch the progression of Orange Wave 4 closely. Its completion may signal the start of Orange Wave 5, which could bring a return to the broader upward trend. The current setup suggests short-term price stability before potential bullish continuation.
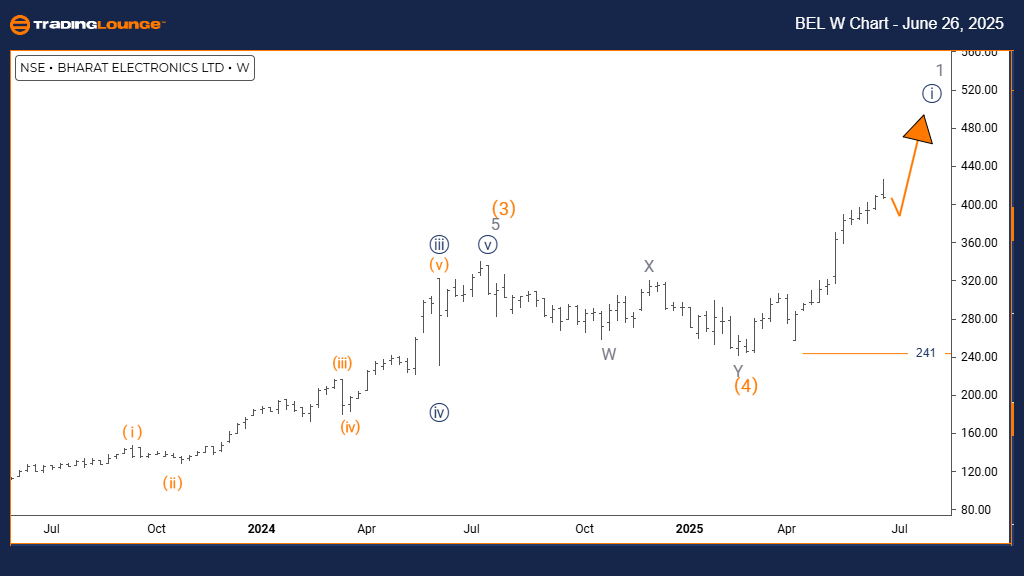
BHARAT ELECTRONICS Elliott Wave Analysis – Trading Lounge Weekly Chart
BHARAT ELECTRONICS Elliott Wave Technical Review
FUNCTION: Bullish Trend
MODE: Impulsive
STRUCTURE: Navy Blue Wave 1
POSITION: Gray Wave 1
DIRECTION NEXT LOWER DEGREES: Navy Blue Wave 2
DETAILS: Navy Blue Wave 1 is ongoing
Wave Cancel/Invalidation Level: 256
The weekly Elliott Wave analysis for BHARAT ELECTRONICS confirms a bullish trend with an ongoing impulsive wave structure. Currently, the market is forming Navy Blue Wave 1, which is part of a larger movement identified as Gray Wave 1. This development marks the beginning of a significant upward cycle.
Navy Blue Wave 1 typically signals the initiation of a strong bullish phase. Once this impulsive wave concludes, a minor correction in the form of Navy Blue Wave 2 is expected, offering a potential buying opportunity before the trend continues upward.
A vital technical level to observe is the wave invalidation level at 256. A decline below this price would nullify the current bullish Elliott Wave scenario. However, if the price remains above this point, the bullish forecast is still considered valid.
Technical indicators and wave structure suggest that BHARAT ELECTRONICS is in a healthy uptrend, supported by the formation of Navy Blue Wave 1 inside Gray Wave 1. The impulsive nature of this wave indicates solid buying interest and potential for sustained gains.
Technical Analyst: Malik Awais
Source: Visit Tradinglounge.com and learn from the Experts. Join TradingLounge Here
Previous: JSW STEEL Elliott Wave Technical Analysis
VALUE Offer - Buy 1 Month & Get 3 Months!Click here
Access 7 Analysts Over 200 Markets Covered. Chat Room With Support