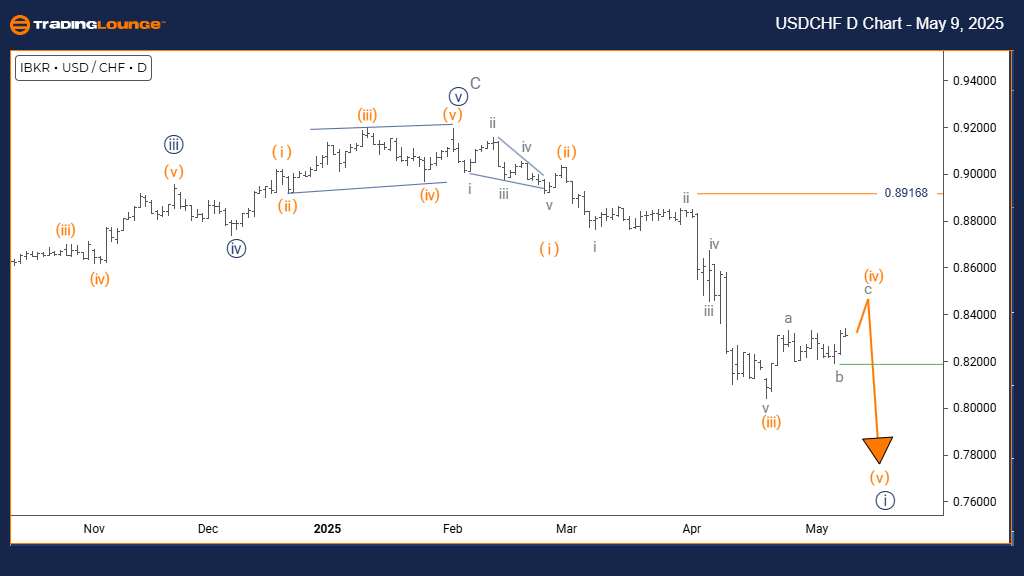
U.S. Dollar / Swiss Franc (USDCHF) Elliott Wave Analysis | Trading Lounge Day Chart
USDCHF Elliott Wave Technical Analysis
FUNCTION: Counter Trend
MODE: Corrective
STRUCTURE: Orange Wave 4
POSITION: Navy Blue Wave 1
NEXT DIRECTION (LOWER DEGREES): Orange Wave 5
DETAILS: Orange Wave 3 has likely completed; Orange Wave 4 is currently forming.
WAVE CANCEL/INVALID LEVEL: 0.89168
Market Analysis Summary
The USDCHF daily timeframe shows a counter-trend correction in progress. The price action aligns with the formation of Orange Wave 4, developing within the broader bearish structure labeled as Navy Blue Wave 1. This suggests the market is temporarily pausing before potentially resuming its downward momentum.
Orange Wave 3 has likely concluded, initiating a typical corrective phase. Orange Wave 4 is expected to exhibit sideways consolidation or shallow pullbacks, consistent with corrective wave characteristics in Elliott Wave theory.
Expected Market Movement
According to the current wave analysis, Orange Wave 5 is projected to unfold next, marking the continuation of the bearish trend. A key invalidation level stands at 0.89168—if price action breaches this point, the existing wave count becomes invalid, and a new analysis would be required.
As long as price remains below the invalidation level, the bearish forecast holds. Traders should watch closely for signs of Orange Wave 4 completion, which could present opportunities to align trades with the anticipated downward move of Wave 5.
Conclusion and Strategy Guidance
This Elliott Wave analysis on USDCHF confirms a corrective move within a dominant bearish trend. The 0.89168 invalidation level should be treated as a risk-management threshold. Traders should maintain a bearish stance and look for entries once Wave 4 shows signs of completion, aligning with the trend continuation toward Wave 5.
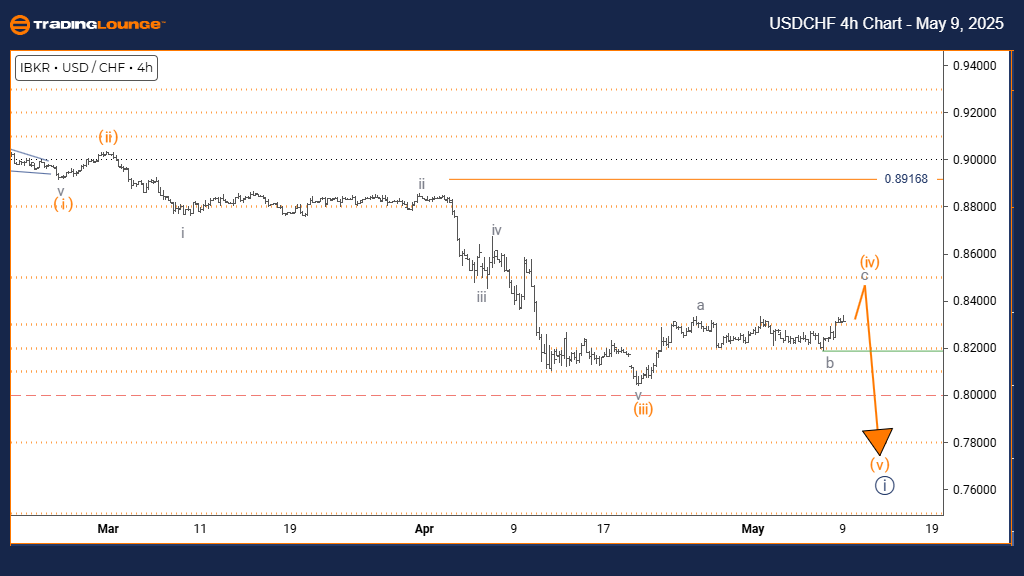
U.S. Dollar / Swiss Franc (USDCHF) Elliott Wave Analysis | Trading Lounge 4-Hour Chart
USDCHF Elliott Wave Technical Analysis
FUNCTION: Counter Trend
MODE: Corrective
STRUCTURE: Orange Wave 4
POSITION: Navy Blue Wave 1
NEXT DIRECTION (LOWER DEGREES): Orange Wave 5
DETAILS: Orange Wave 3 likely finalized; Orange Wave 4 currently developing.
WAVE CANCEL/INVALID LEVEL: 0.89168
Technical Market Overview
In the 4-hour timeframe, USDCHF displays a corrective phase inside a broader bearish Elliott Wave pattern. This correction is taking shape as Orange Wave 4 within the larger structure of Navy Blue Wave 1. The setup implies a short-term retracement against the overall downward trend.
The apparent completion of Orange Wave 3 has triggered the formation of Wave 4. This phase often includes moderate recoveries or sideways price action, providing limited upside before a potential move lower resumes.
Outlook and Next Steps
As the correction matures, Orange Wave 5 is anticipated to emerge next in the wave sequence, likely continuing the prevailing bearish momentum. The 0.89168 level serves as the critical invalidation point—price action exceeding this level would challenge the current wave count and suggest an alternative structure may be forming.
Until that level is breached, the prevailing outlook remains bearish. Traders should monitor for signs indicating the end of Wave 4, as these signals can align with trade setups favoring downside continuation.
Trading Implications and Strategy
The structure reinforces a bearish continuation bias following the current correction. Traders are encouraged to track wave progress closely and stay alert near the invalidation level for any deviation from the wave count. This phase presents opportunities for strategic entries, risk management, and position alignment with the broader trend direction.
Technical Analyst: Malik Awais
Source: Visit Tradinglounge.com and learn from the Experts. Join TradingLounge Here
Previous: USDJPY Elliott Wave Technical Analysis
VALUE Offer - Buy 1 Month & Get 3 Months!Click here
Access 7 Analysts Over 200 Markets Covered. Chat Room With Support