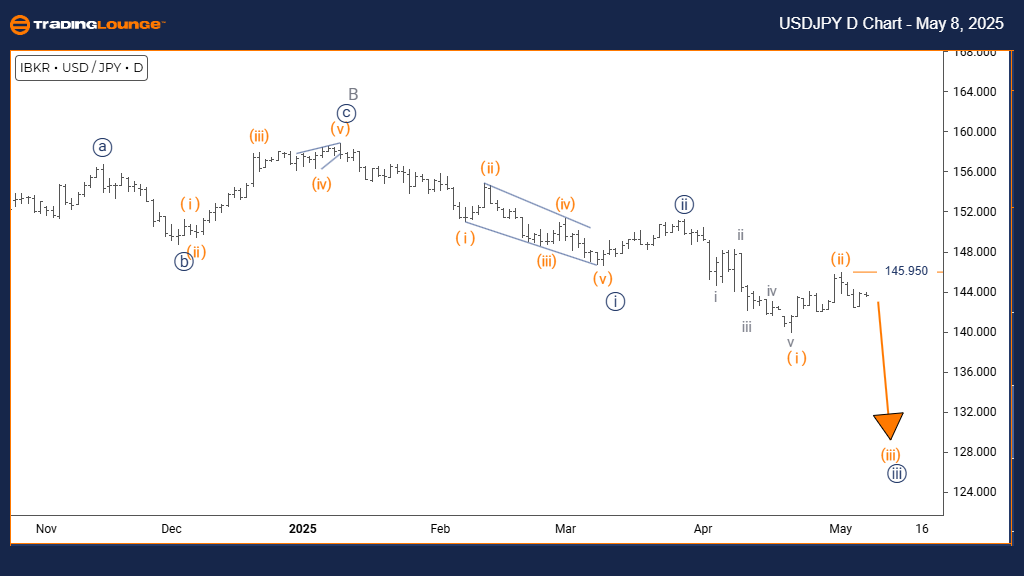
U.S. Dollar / Japanese Yen (USDJPY) Elliott Wave Analysis | Trading Lounge Day Chart
USDJPY Elliott Wave Technical Analysis
FUNCTION: Bearish Trend
MODE: Impulsive
STRUCTURE: Orange Wave 3
POSITION: Navy Blue Wave 3
DIRECTION NEXT LOWER DEGREES: Orange Wave 3 (in progress)
DETAILS: Orange Wave 2 completed; Orange Wave 3 currently developing.
Wave Cancel Invalidation Level: 145.950
The USDJPY Elliott Wave Analysis on the daily timeframe outlines a bearish trend for the U.S. Dollar against the Japanese Yen. The structure is identified as impulsive, indicating strong downward pressure. The active pattern is Orange Wave 3, unfolding within the larger Navy Blue Wave 3 sequence. This analysis highlights an advancing bearish phase, with Orange Wave 3 progressing after the confirmed end of Orange Wave 2.
The next expected move at a lower degree is the continuation of Orange Wave 3, reinforcing the current bearish market outlook. The conclusion of Orange Wave 2 signals the end of a corrective move, opening further downside potential. Traders must monitor the key invalidation level at 145.950; breaching this level would invalidate the current wave structure and suggest a shift towards a corrective or reversal pattern.
This technical setup stresses the dominance of sellers, with the impulsive nature confirming persistent bearish momentum. Traders should look for confirmation of the downtrend continuation while closely watching for any movement above the 145.950 invalidation level. The daily chart framework suggests that unless critical resistance levels are broken, the bearish trend in USDJPY remains intact.
Conclusion:
The USDJPY pair maintains a bearish outlook on the daily chart, driven by Orange Wave 3 within the broader Navy Blue Wave 3 structure. Monitoring the crucial invalidation point at 145.950 is essential, as a breach could signal a new wave count. This wave analysis offers a structured approach to understanding USDJPY's ongoing bearish trajectory, emphasizing key levels critical for traders.
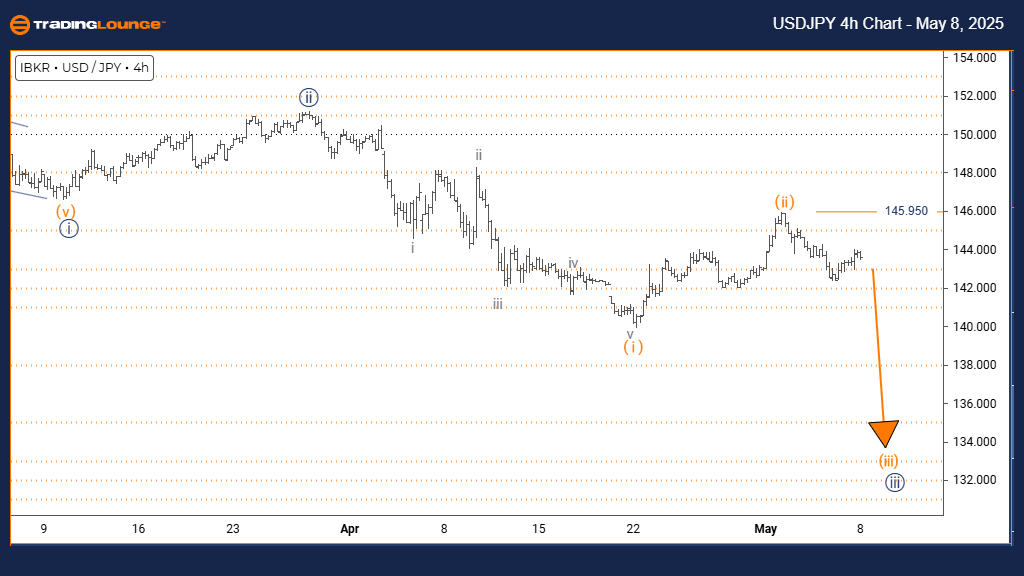
U.S. Dollar / Japanese Yen (USDJPY) Elliott Wave Analysis | Trading Lounge 4-Hour Chart
USDJPY Elliott Wave Technical Analysis
FUNCTION: Bearish Trend
MODE: Impulsive
STRUCTURE: Orange Wave 3
POSITION: Navy Blue Wave 3
DIRECTION NEXT LOWER DEGREES: Orange Wave 3 (in progress)
DETAILS: Orange Wave 2 completed; Orange Wave 3 now advancing.
Wave Cancel Invalidation Level: 145.950
The USDJPY Elliott Wave Analysis on the 4-hour timeframe shows a strong bearish trend for the U.S. Dollar against the Japanese Yen. The price structure fits an impulsive decline, with Orange Wave 3 unfolding inside a larger Navy Blue Wave 3. This configuration points to a continued downtrend, with Orange Wave 3 already underway.
The market completed Orange Wave 2, transitioning into the stronger downward movement of Orange Wave 3, which suggests growing downside momentum. Traders should keep a close eye on the critical invalidation level at 145.950; surpassing this threshold would negate the current bearish wave scenario and possibly indicate a market reversal.
The analysis reinforces a bearish technical function, emphasizing impulsive selling pressure. Being inside Navy Blue Wave 3 and early in Orange Wave 3 signals strong selling conditions ahead. Traders are advised to confirm the trend's strength and monitor the invalidation level to adjust risk management strategies effectively.
Conclusion:
The USDJPY 4-hour analysis maintains a bearish structure, forecasting further downward action as part of Orange Wave 3 within the broader Navy Blue Wave 3. Monitoring 145.950 remains critical, as a breach could reshape the Elliott wave perspective. This analysis delivers a straightforward view of USDJPY's bearish setup and upcoming price movements.
Technical Analyst: Malik Awais
Source: Visit Tradinglounge.com and learn from the Experts. Join TradingLounge Here
Previous: EURUSD Elliott Wave Technical Analysis
VALUE Offer - Buy 1 Month & Get 3 Months!Click here
Access 7 Analysts Over 200 Markets Covered. Chat Room With Support