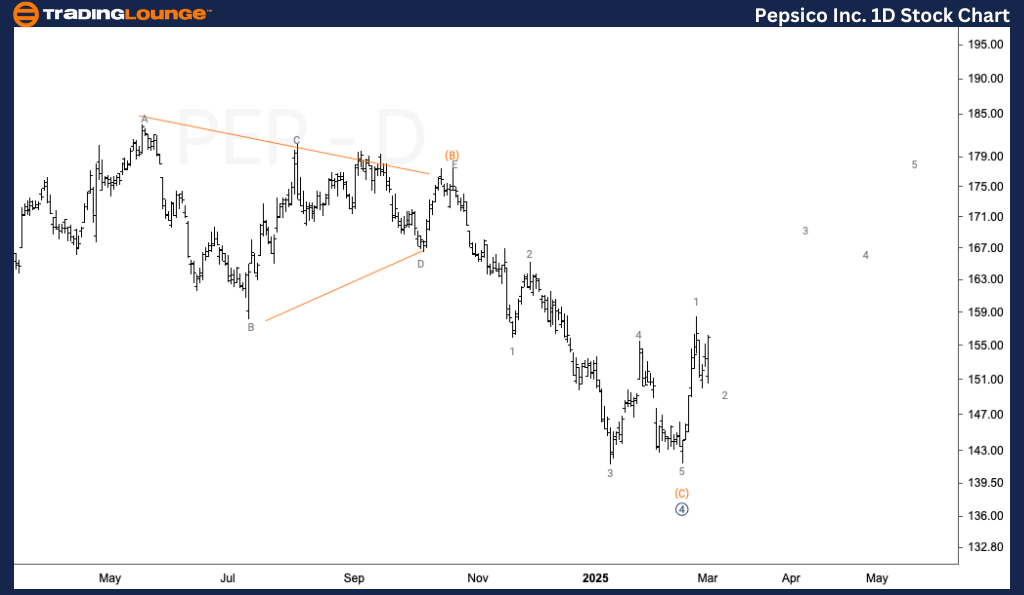
PepsiCo Inc. (PEP) Elliott Wave Analysis – Trading Lounge Daily Chart
Function: Trend
Mode: Impulsive
Structure: Motive
Position: Wave 1 of (1)
Direction: Upside in wave 3
Details: PepsiCo (PEP) is approaching a potential bottom in Minor wave 2, targeting the $150 price level. A confirmed reversal from this area would validate the continuation of a long-term uptrend, with wave 3 signaling bullish momentum.
PEP Elliott Wave Technical Analysis Summary
Daily Chart : PepsiCo (PEP) is nearing a potential bottom in Minor wave 2 around $150. This level serves as a critical support zone, and a bullish breakout from here would confirm the next upside movement in wave 3. Traders should watch for price action confirmation to validate the continuation of the long-term uptrend.

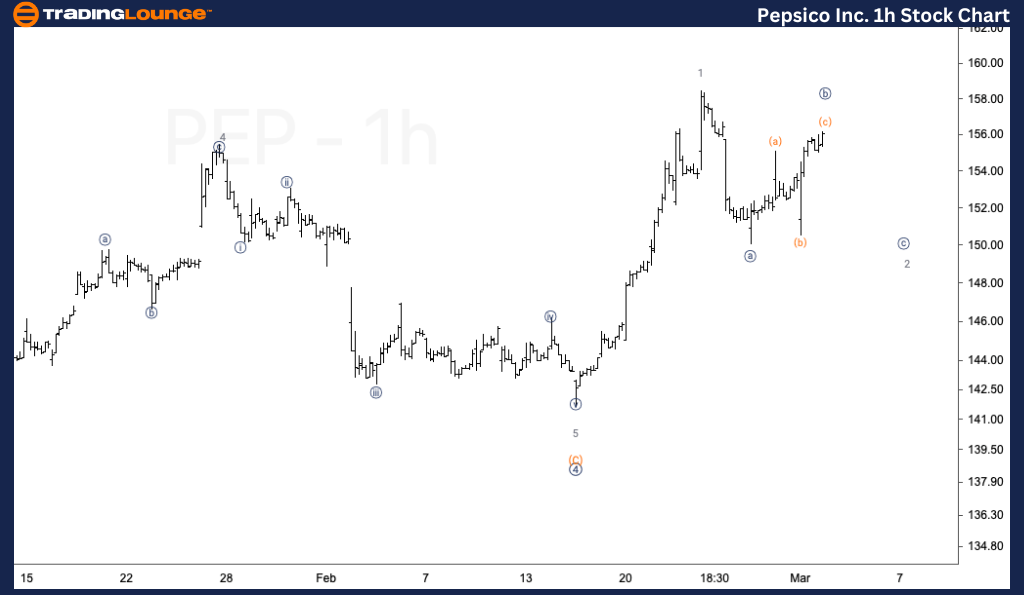
PepsiCo Inc. (PEP) Elliott Wave Analysis – Trading Lounge 1H Chart
PEP Daily Chart Analysis
Function: Trend
Mode: Impulsive
Structure: Motive
Position: Wave {b} of 2
Direction: Downside in wave {c}
Details: PepsiCo (PEP) is expected to see one more downside leg into wave {c} of 2, with $150 as the target zone. This price level aligns with wave {c} reaching equality with wave {a}, making it a key support level before a potential bullish reversal.
PEP Elliott Wave Technical Analysis Summary
1-Hour Chart Analysis: PepsiCo (PEP) remains in a corrective phase, moving lower into wave {c} of 2. The $150 support level is a crucial area to monitor for a potential bottom. If the price reacts positively here, it could mark the completion of the correction, setting the stage for the next bullish wave 3 rally.
Technical Analyst: Malik Awais
Source: visit Tradinglounge.com and learn From the Experts Join TradingLounge Here
Previous: Berkshire Hathaway Inc. (BRK.B) Elliott Wave Technical Analysis
VALUE Offer - Buy 1 Month & Get 3 Months!Click here
Access 7 Analysts Over 200 Markets Covered. Chat Room With Support
