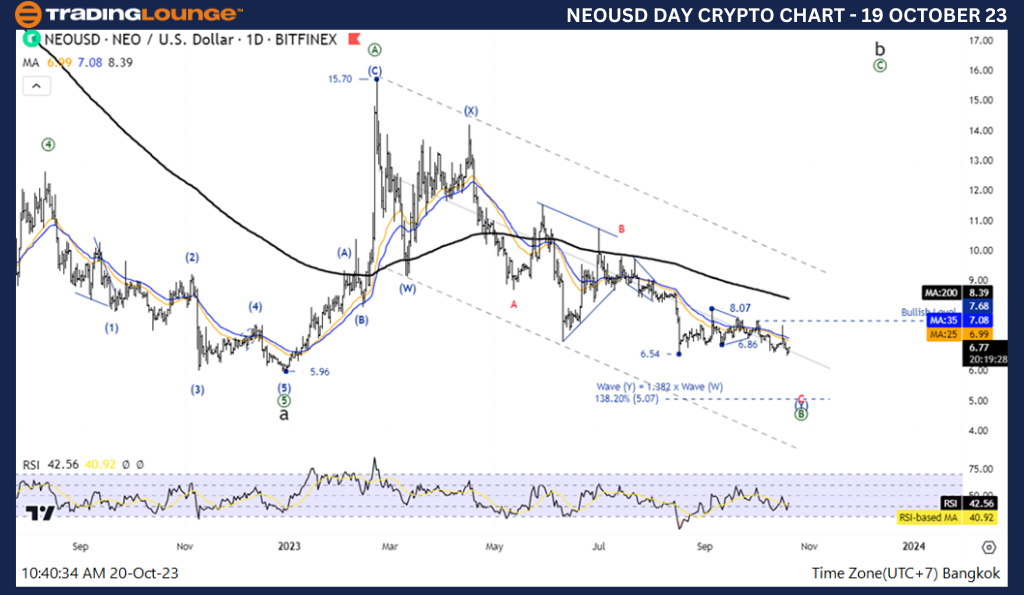
Elliott Wave Analysis TradingLounge Daily Chart, 20 October 23,
NEO/U.S. dollar(NEOUSD)
NEOUSD Elliott Wave Technical Analysis
Function: Counter Trend
Mode: Corrective
Structure: Double Corrective
Position: Wave (Y)
Direction Next higher Degrees: Wave ((B)) of Flat
Wave Cancel invalid Level: 5.96
Details: The corrective of wave (Y) Likely move down to 5.94.
NEO/U.S. dollar(NEOUSD)Trading Strategy: A decline below 7.08 makes the triangle complete at 7.68, also the price below the MA200 Line, Overview still is a downtrend, and the price move to wave ((5)) which a last wave before change a trend
NEO/U.S. dollar(NEOUSD)Technical Indicators: The price is below the MA200 indicating a downtrend, RSI is a Bearish Momentum.
TradingLounge Analyst: Kittiampon Somboonsod, CEWA
Source: Tradinglounge.com get trial here!
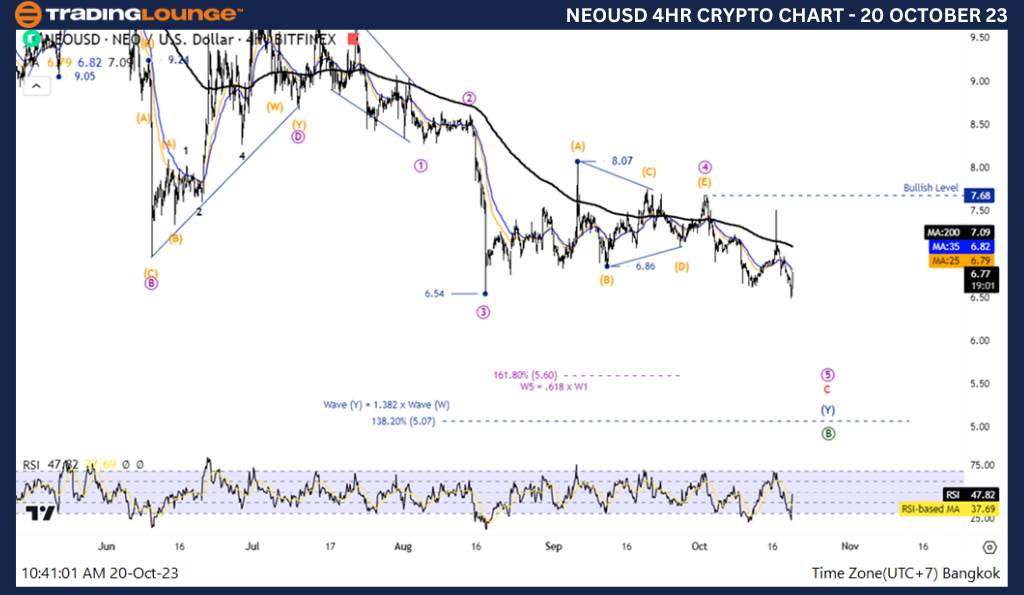
Elliott Wave Analysis TradingLounge 4H Chart, 20 October 23,
NEO/U.S. dollar(NEOUSD)
NEOUSD Elliott Wave Technical Analysis
Function: Counter Trend
Mode: Corrective
Structure: Triangle
Position: Wave (E)
Direction Next higher Degrees: Wave (4) of Impulse
Wave Cancel invalid Level:
Details: Weve 4 may be complete and the ptice decline again in wave 5
NEO/U.S. dollar(NEOUSD)Trading Strategy: A decline below 7.08 makes the triangle complete at 7.68, also the price below the MA200 Line, Overview still is a downtrend, and the price move to wave ((5)) which a last wave before change a trend
NEO/U.S. dollar(NEOUSD)Technical Indicators: The price is below the MA200 indicating a downtrend, RSI is a Bearish Momentum.