ASX: Vanguard V300AEQ ETF Units – VAS Elliott Wave Technical Analysis TradingLounge (1D Chart)

Greetings, today's Elliott Wave analysis provides an update on the Australian Stock Exchange (ASX) with a focus on V300AEQ ETF Units – VAS. We have confirmed the end of wave 2-red, and wave 3-red is beginning to push higher.

ASX: V300AEQ ETF Units – VAS Elliott Wave Technical Analysis

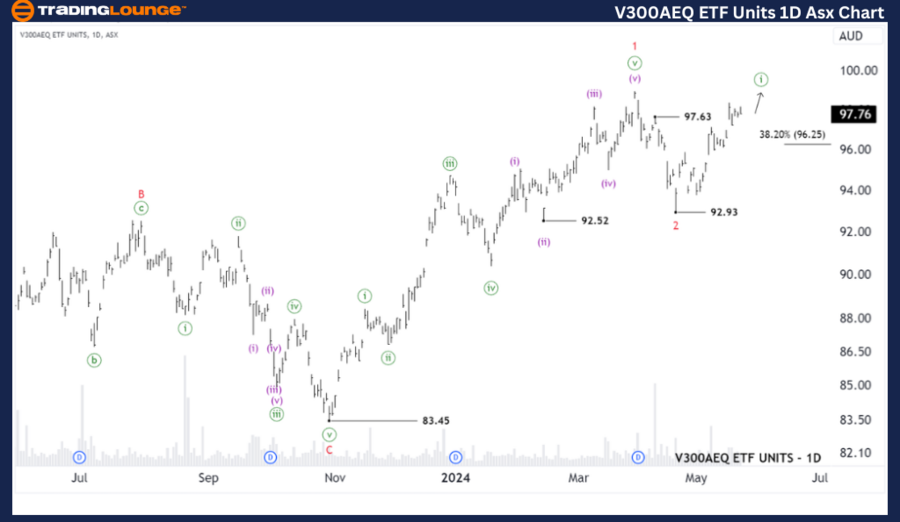
ASX: V300AEQ ETF Units – VAS 1D Chart (Semilog Scale) Analysis

Function: Major trend (Minor degree, red)

Mode: Motive

Structure: Impulse

Position: Wave ((i))-green of Wave 3-red

Details: The short-term outlook indicates that wave ((i))-green is developing and continues to push higher. The price must remain above 96.25. A drop below this level would signal that wave ((ii))-green is unfolding.

Invalidation point: 83.45

V300AEQ-ETF-Units-1D...


ASX: V300AEQ ETF Units – VAS Elliott Wave Technical Analysis (4-Hour Chart)

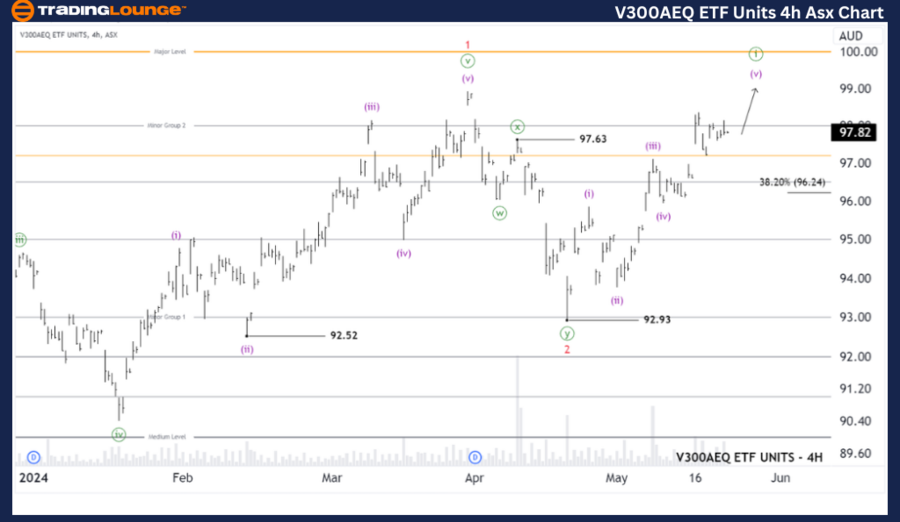
ASX: V300AEQ ETF Units – VAS 4-Hour Chart Analysis

Function: Major trend (Minute degree, green)

Mode: Motive

Structure: Impulse

Position: Wave (v)-purple of Wave ((iii))-green

Details: The even shorter-term outlook suggests that wave 3-red is unfolding, with wave (v)-purple nearing completion. This coincides with the completion of wave ((i))-green. The trend is likely to continue higher, provided the price stays above 96.24. A drop below this level would indicate that wave ((ii))-green is starting to push lower, followed by wave ((iii))-green pushing higher again.

Invalidation point: 92.93

Technical Analyst: Hua (Shane) Cuong, CEWA-M (Master’s Designation).

Source: visit Tradinglounge.com and learn From the Experts Join TradingLounge Here 

Previous: REA GROUP LTD – Elliott Wave Technical Analysis

Special Trial Offer - 0.76 Cents a Day for 3 Months! Click here

Access 7 Analysts Over 170 Markets Covered. Chat Room With Support

V300AEQ-ETF-Units-4h...

Conclusion

Our analysis and forecast of contextual trends, along with the short-term outlook for ASX: V300AEQ ETF Units – VAS, aim to provide valuable insights into current market trends and strategies for effective capitalization. We offer specific price points as validation or invalidation signals for our wave count, enhancing the confidence in our perspective. By combining these factors, we strive to offer readers the most objective and professional perspective on market trends.

Related

SGX TSI Iron Ore Commodity Elliott Wave Technical Analysis & Key Support Levels for Traders, Miners, and Steel Producers in 2025

SGX TSI Iron Ore Commodity Elliott Wave Technical Analysis & Key Support Levels for Traders, Miners, and Steel Producers in 2025

The SGX TSI Iron Ore Futures is a key benchmark for iron ore prices, widely used by traders, miners,...

Read More >
Mastering ChainLink: In-Depth Crypto Price News Today Elliott Wave Technical Analysis

Mastering ChainLink: In-Depth Crypto Price News Today Elliott Wave Technical Analysis

This article provides a detailed Elliott Wave analysis of ChainLink (LINKUSD), offering key insights...

Read More >
Costco Wholesale Corp. (COST) Elliott Wave Chart Signals Start of Bearish Wave C with Key Support Levels and Trade Setup Potential

Costco Wholesale Corp. (COST) Elliott Wave Chart Signals Start of Bearish Wave C with Key Support Levels and Trade Setup Potential

Costco’s stock appears to have completed wave (B) near $1000. Elliott Wave analysis suggests a bear...

Read More >
ASX FORTESCUE LTD Elliott Wave Analysis: FMG Fortescue Metals Stock Forecast, Key Trading Strategies, Wave Count Insights

ASX FORTESCUE LTD Elliott Wave Analysis: FMG Fortescue Metals Stock Forecast, Key Trading Strategies, Wave Count Insights

Elliott Wave analysis explores the current wave structure of ASX: FMG (Fortescue Metals Group), high...

Read More >
Nikkei 225 Index Elliott Wave Technical Analysis: Timely Updates, Expert Forecasts, and Recommended N225 investment tips

Nikkei 225 Index Elliott Wave Technical Analysis: Timely Updates, Expert Forecasts, and Recommended N225 investment tips

Dive into a comprehensive Elliott Wave analysis of the Nikkei 225 (N225) with insights on bullish tr...

Read More >

$1 for 2 Weeks

then $29 a month!

What a Special Offer!

Trade Recommendations

Unleash the power of deversified trading with our comprehensive portfolio, covering 250+ markets:

  • Stock Trades
  • Crypto Trades
  • Forex Trades
  • Commodity Trades
Elliott Wave Analysis

Gain a competitive edge with expert insights and AI-powered Elliott Wave charting into:

  • Global Indices
  • US Stocks & ASX Stocks
  • Forex & Crypto
  • Commodities
Top-Notch Trading Tools

Equip yourself with the tools of success:

  • Real-time Chat rooms
  • Elliott Wave Algorithm
  • Portfolio tools
  • TradingLevels
  • Screener
  • Trading Game
7 Elliott Wave Analysts

Stay ahead of the market with daily charts and insightful videos
Your secret to strategic trading!

JOIN HERE


Welcome to TradingLounge (ASIC A.R.No. 321187), specialists in trades, trading education and technical analysis, covering stocks, indices, commodities, forex and cryptocurrencies.

When you join TradingLounge you have access to everything we offer, including trade tools, educational content and a social platform to chat with like-minded investors.

Read more

@Copyright 2024 by tradinglounge.com

Contact Us

Australian no: 02 4787 6020

International no: +61 (2) 47876020

Pay with:

Find us on